Immigrants from Chile vs Immigrants from Romania In Labor Force | Age 35-44
COMPARE
Immigrants from Chile
Immigrants from Romania
In Labor Force | Age 35-44
In Labor Force | Age 35-44 Comparison
Immigrants from Chile
Immigrants from Romania
84.6%
IN LABOR FORCE | AGE 35-44
84.6/ 100
METRIC RATING
137th/ 347
METRIC RANK
84.8%
IN LABOR FORCE | AGE 35-44
94.7/ 100
METRIC RATING
107th/ 347
METRIC RANK
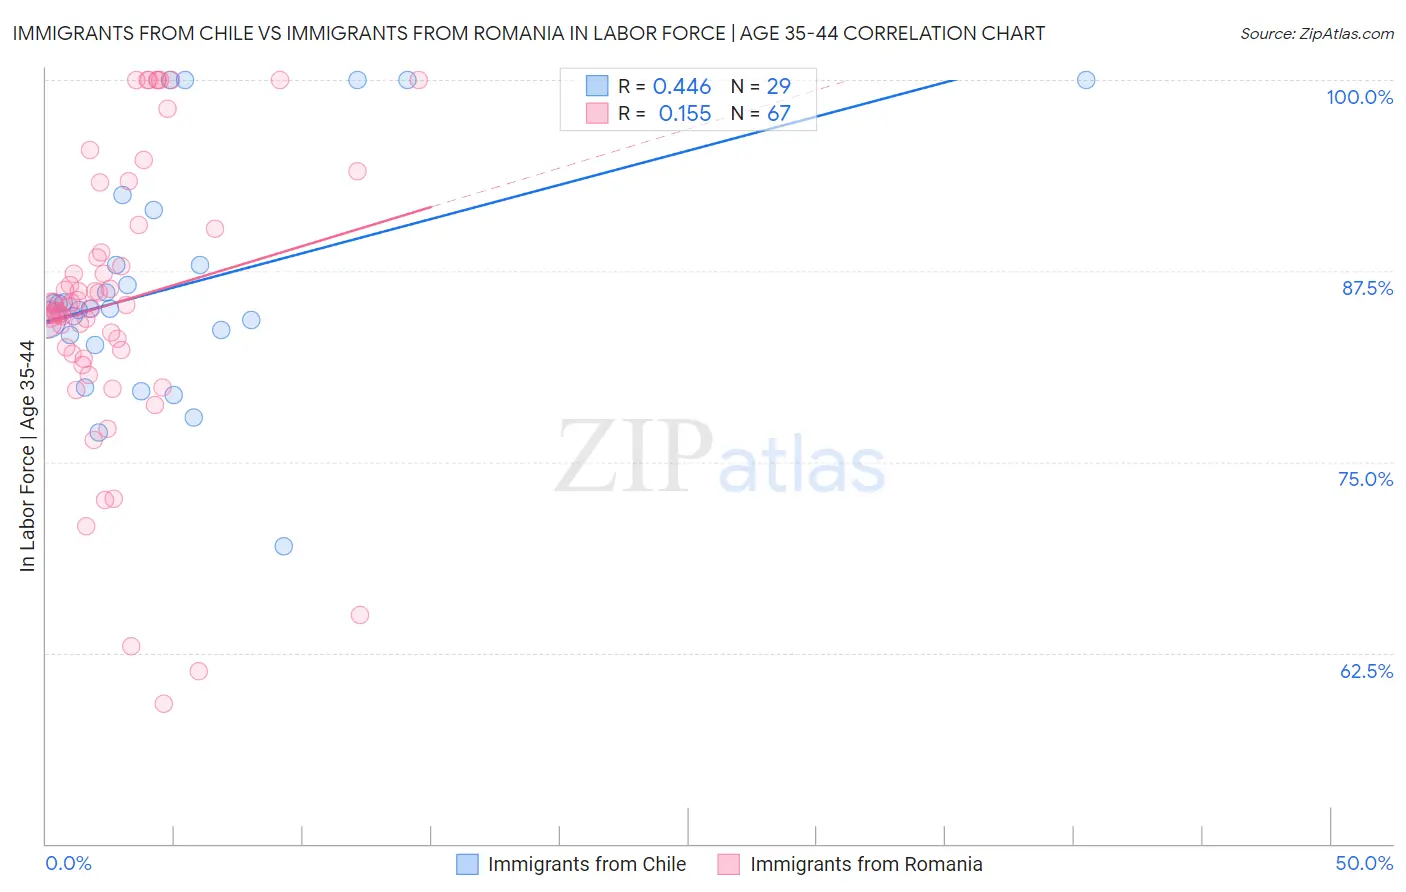
Immigrants from Chile vs Immigrants from Romania In Labor Force | Age 35-44 Correlation Chart
The statistical analysis conducted on geographies consisting of 218,627,493 people shows a moderate positive correlation between the proportion of Immigrants from Chile and labor force participation rate among population between the ages 35 and 44 in the United States with a correlation coefficient (R) of 0.446 and weighted average of 84.6%. Similarly, the statistical analysis conducted on geographies consisting of 256,974,600 people shows a poor positive correlation between the proportion of Immigrants from Romania and labor force participation rate among population between the ages 35 and 44 in the United States with a correlation coefficient (R) of 0.155 and weighted average of 84.8%, a difference of 0.19%.
In Labor Force | Age 35-44 Correlation Summary
| Measurement | Immigrants from Chile | Immigrants from Romania |
| Minimum | 69.5% | 59.2% |
| Maximum | 100.0% | 100.0% |
| Range | 30.5% | 40.8% |
| Mean | 86.5% | 85.5% |
| Median | 85.0% | 85.2% |
| Interquartile 25% (IQ1) | 83.0% | 82.1% |
| Interquartile 75% (IQ3) | 89.7% | 90.3% |
| Interquartile Range (IQR) | 6.7% | 8.2% |
| Standard Deviation (Sample) | 7.6% | 9.3% |
| Standard Deviation (Population) | 7.5% | 9.2% |
Similar Demographics by In Labor Force | Age 35-44
Demographics Similar to Immigrants from Chile by In Labor Force | Age 35-44
In terms of in labor force | age 35-44, the demographic groups most similar to Immigrants from Chile are Afghan (84.6%, a difference of 0.020%), Czechoslovakian (84.6%, a difference of 0.020%), Immigrants from Zaire (84.6%, a difference of 0.020%), Immigrants from Malaysia (84.6%, a difference of 0.040%), and Immigrants from Japan (84.6%, a difference of 0.040%).
| Demographics | Rating | Rank | In Labor Force | Age 35-44 |
| Bhutanese | 89.7 /100 | #130 | Excellent 84.7% |
| Immigrants | Scotland | 89.6 /100 | #131 | Excellent 84.7% |
| Austrians | 89.4 /100 | #132 | Excellent 84.7% |
| Argentineans | 88.4 /100 | #133 | Excellent 84.6% |
| Immigrants | Korea | 88.2 /100 | #134 | Excellent 84.6% |
| Immigrants | Malaysia | 87.5 /100 | #135 | Excellent 84.6% |
| Afghans | 86.3 /100 | #136 | Excellent 84.6% |
| Immigrants | Chile | 84.6 /100 | #137 | Excellent 84.6% |
| Czechoslovakians | 82.6 /100 | #138 | Excellent 84.6% |
| Immigrants | Zaire | 82.5 /100 | #139 | Excellent 84.6% |
| Immigrants | Japan | 81.4 /100 | #140 | Excellent 84.6% |
| Immigrants | Belgium | 80.8 /100 | #141 | Excellent 84.6% |
| Immigrants | Uruguay | 80.1 /100 | #142 | Excellent 84.6% |
| Immigrants | Ukraine | 79.7 /100 | #143 | Good 84.6% |
| Immigrants | Jamaica | 79.4 /100 | #144 | Good 84.6% |
Demographics Similar to Immigrants from Romania by In Labor Force | Age 35-44
In terms of in labor force | age 35-44, the demographic groups most similar to Immigrants from Romania are Immigrants from Bahamas (84.8%, a difference of 0.0%), South American (84.8%, a difference of 0.010%), Immigrants from Argentina (84.8%, a difference of 0.010%), Immigrants from Russia (84.8%, a difference of 0.010%), and Immigrants from Southern Europe (84.8%, a difference of 0.020%).
| Demographics | Rating | Rank | In Labor Force | Age 35-44 |
| Immigrants | Czechoslovakia | 95.9 /100 | #100 | Exceptional 84.8% |
| Immigrants | Australia | 95.5 /100 | #101 | Exceptional 84.8% |
| Immigrants | Southern Europe | 95.3 /100 | #102 | Exceptional 84.8% |
| Immigrants | Belarus | 95.3 /100 | #103 | Exceptional 84.8% |
| Immigrants | Sweden | 95.2 /100 | #104 | Exceptional 84.8% |
| South Americans | 95.0 /100 | #105 | Exceptional 84.8% |
| Immigrants | Bahamas | 94.8 /100 | #106 | Exceptional 84.8% |
| Immigrants | Romania | 94.7 /100 | #107 | Exceptional 84.8% |
| Immigrants | Argentina | 94.5 /100 | #108 | Exceptional 84.8% |
| Immigrants | Russia | 94.5 /100 | #109 | Exceptional 84.8% |
| Filipinos | 93.8 /100 | #110 | Exceptional 84.7% |
| Ukrainians | 93.5 /100 | #111 | Exceptional 84.7% |
| Immigrants | Western Africa | 93.4 /100 | #112 | Exceptional 84.7% |
| Uruguayans | 93.3 /100 | #113 | Exceptional 84.7% |
| Chileans | 93.2 /100 | #114 | Exceptional 84.7% |