Immigrants from Chile vs Immigrants from Switzerland In Labor Force | Age 35-44
COMPARE
Immigrants from Chile
Immigrants from Switzerland
In Labor Force | Age 35-44
In Labor Force | Age 35-44 Comparison
Immigrants from Chile
Immigrants from Switzerland
84.6%
IN LABOR FORCE | AGE 35-44
84.6/ 100
METRIC RATING
137th/ 347
METRIC RANK
84.5%
IN LABOR FORCE | AGE 35-44
65.9/ 100
METRIC RATING
155th/ 347
METRIC RANK
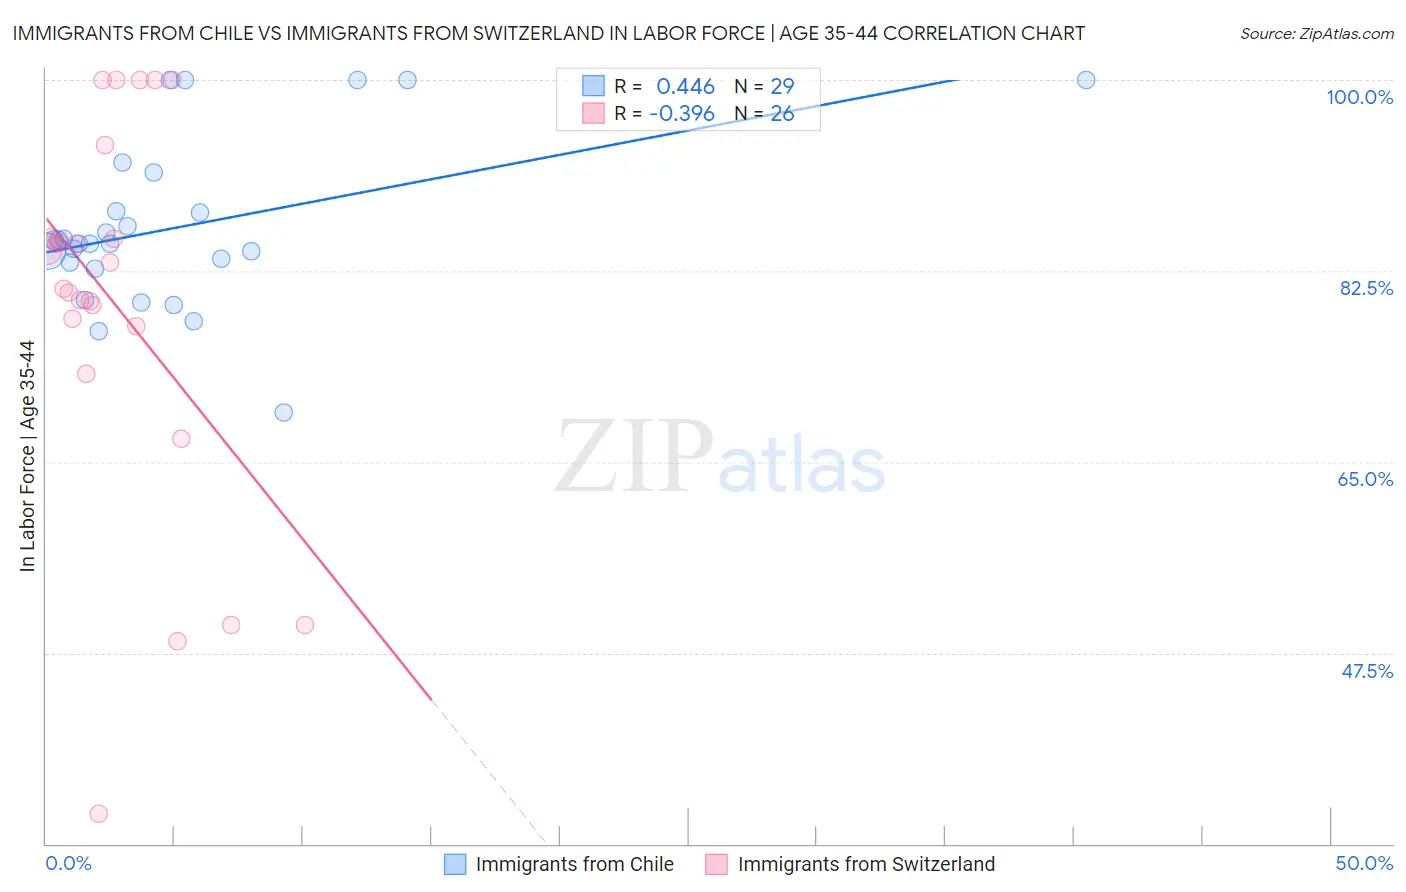
Immigrants from Chile vs Immigrants from Switzerland In Labor Force | Age 35-44 Correlation Chart
The statistical analysis conducted on geographies consisting of 218,627,493 people shows a moderate positive correlation between the proportion of Immigrants from Chile and labor force participation rate among population between the ages 35 and 44 in the United States with a correlation coefficient (R) of 0.446 and weighted average of 84.6%. Similarly, the statistical analysis conducted on geographies consisting of 148,071,770 people shows a mild negative correlation between the proportion of Immigrants from Switzerland and labor force participation rate among population between the ages 35 and 44 in the United States with a correlation coefficient (R) of -0.396 and weighted average of 84.5%, a difference of 0.17%.
In Labor Force | Age 35-44 Correlation Summary
| Measurement | Immigrants from Chile | Immigrants from Switzerland |
| Minimum | 69.5% | 32.7% |
| Maximum | 100.0% | 100.0% |
| Range | 30.5% | 67.3% |
| Mean | 86.5% | 79.4% |
| Median | 85.0% | 82.1% |
| Interquartile 25% (IQ1) | 83.0% | 77.4% |
| Interquartile 75% (IQ3) | 89.7% | 85.5% |
| Interquartile Range (IQR) | 6.7% | 8.1% |
| Standard Deviation (Sample) | 7.6% | 17.4% |
| Standard Deviation (Population) | 7.5% | 17.1% |
Demographics Similar to Immigrants from Chile and Immigrants from Switzerland by In Labor Force | Age 35-44
In terms of in labor force | age 35-44, the demographic groups most similar to Immigrants from Chile are Afghan (84.6%, a difference of 0.020%), Czechoslovakian (84.6%, a difference of 0.020%), Immigrants from Zaire (84.6%, a difference of 0.020%), Immigrants from Japan (84.6%, a difference of 0.040%), and Immigrants from Belgium (84.6%, a difference of 0.040%). Similarly, the demographic groups most similar to Immigrants from Switzerland are Immigrants from Israel (84.4%, a difference of 0.010%), Trinidadian and Tobagonian (84.5%, a difference of 0.030%), Iranian (84.5%, a difference of 0.030%), Immigrants from Taiwan (84.5%, a difference of 0.040%), and Romanian (84.5%, a difference of 0.050%).
| Demographics | Rating | Rank | In Labor Force | Age 35-44 |
| Afghans | 86.3 /100 | #136 | Excellent 84.6% |
| Immigrants | Chile | 84.6 /100 | #137 | Excellent 84.6% |
| Czechoslovakians | 82.6 /100 | #138 | Excellent 84.6% |
| Immigrants | Zaire | 82.5 /100 | #139 | Excellent 84.6% |
| Immigrants | Japan | 81.4 /100 | #140 | Excellent 84.6% |
| Immigrants | Belgium | 80.8 /100 | #141 | Excellent 84.6% |
| Immigrants | Uruguay | 80.1 /100 | #142 | Excellent 84.6% |
| Immigrants | Ukraine | 79.7 /100 | #143 | Good 84.6% |
| Immigrants | Jamaica | 79.4 /100 | #144 | Good 84.6% |
| Immigrants | Saudi Arabia | 79.4 /100 | #145 | Good 84.6% |
| Immigrants | Asia | 78.7 /100 | #146 | Good 84.5% |
| Immigrants | Netherlands | 76.6 /100 | #147 | Good 84.5% |
| South American Indians | 73.6 /100 | #148 | Good 84.5% |
| Okinawans | 73.5 /100 | #149 | Good 84.5% |
| Immigrants | Nigeria | 73.3 /100 | #150 | Good 84.5% |
| Romanians | 72.1 /100 | #151 | Good 84.5% |
| Immigrants | Taiwan | 71.4 /100 | #152 | Good 84.5% |
| Trinidadians and Tobagonians | 69.5 /100 | #153 | Good 84.5% |
| Iranians | 69.4 /100 | #154 | Good 84.5% |
| Immigrants | Switzerland | 65.9 /100 | #155 | Good 84.5% |
| Immigrants | Israel | 64.3 /100 | #156 | Good 84.4% |