Immigrants from Chile vs Immigrants from Romania Unemployment Among Seniors over 65 years
COMPARE
Immigrants from Chile
Immigrants from Romania
Unemployment Among Seniors over 65 years
Unemployment Among Seniors over 65 years Comparison
Immigrants from Chile
Immigrants from Romania
5.1%
UNEMPLOYMENT AMONG SENIORS OVER 65 YEARS
83.0/ 100
METRIC RATING
140th/ 347
METRIC RANK
5.1%
UNEMPLOYMENT AMONG SENIORS OVER 65 YEARS
72.4/ 100
METRIC RATING
156th/ 347
METRIC RANK
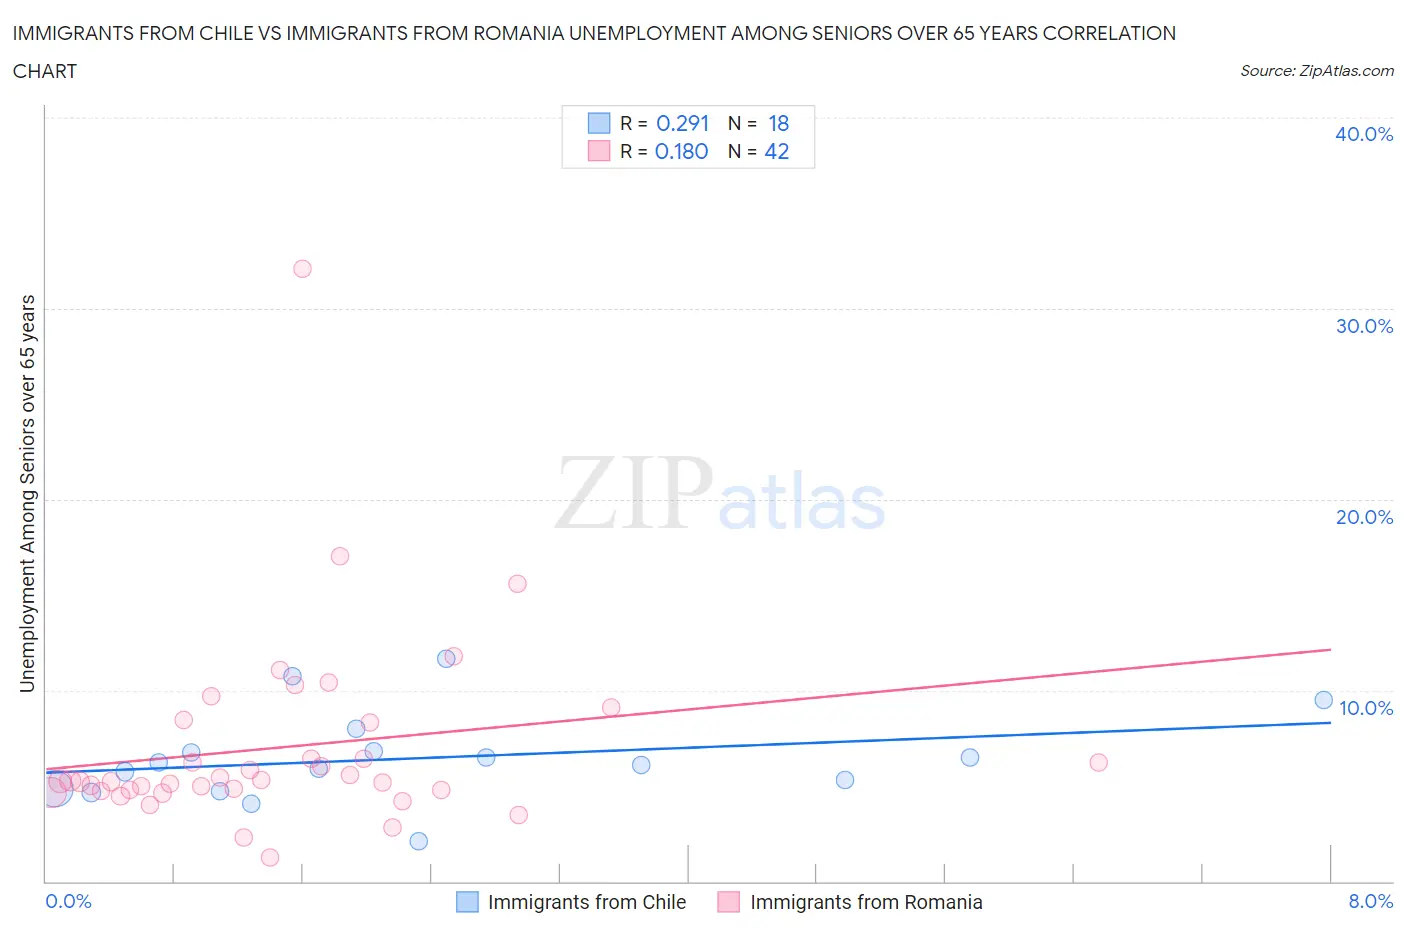
Immigrants from Chile vs Immigrants from Romania Unemployment Among Seniors over 65 years Correlation Chart
The statistical analysis conducted on geographies consisting of 207,338,369 people shows a weak positive correlation between the proportion of Immigrants from Chile and unemployment rate amomg seniors over the age of 65 in the United States with a correlation coefficient (R) of 0.291 and weighted average of 5.1%. Similarly, the statistical analysis conducted on geographies consisting of 242,736,700 people shows a poor positive correlation between the proportion of Immigrants from Romania and unemployment rate amomg seniors over the age of 65 in the United States with a correlation coefficient (R) of 0.180 and weighted average of 5.1%, a difference of 0.50%.
Unemployment Among Seniors over 65 years Correlation Summary
| Measurement | Immigrants from Chile | Immigrants from Romania |
| Minimum | 2.1% | 1.2% |
| Maximum | 11.6% | 32.1% |
| Range | 9.5% | 30.9% |
| Mean | 6.4% | 7.0% |
| Median | 6.2% | 5.2% |
| Interquartile 25% (IQ1) | 4.9% | 4.8% |
| Interquartile 75% (IQ3) | 6.8% | 8.3% |
| Interquartile Range (IQR) | 1.9% | 3.5% |
| Standard Deviation (Sample) | 2.3% | 5.1% |
| Standard Deviation (Population) | 2.3% | 5.0% |
Demographics Similar to Immigrants from Chile and Immigrants from Romania by Unemployment Among Seniors over 65 years
In terms of unemployment among seniors over 65 years, the demographic groups most similar to Immigrants from Chile are Immigrants from Panama (5.1%, a difference of 0.0%), New Zealander (5.1%, a difference of 0.020%), Cherokee (5.1%, a difference of 0.080%), Immigrants from Indonesia (5.1%, a difference of 0.11%), and Senegalese (5.1%, a difference of 0.14%). Similarly, the demographic groups most similar to Immigrants from Romania are Basque (5.1%, a difference of 0.020%), Immigrants from Hong Kong (5.1%, a difference of 0.070%), Immigrants from Czechoslovakia (5.1%, a difference of 0.090%), Canadian (5.1%, a difference of 0.10%), and Immigrants from Northern Europe (5.1%, a difference of 0.10%).
| Demographics | Rating | Rank | Unemployment Among Seniors over 65 years |
| New Zealanders | 83.2 /100 | #138 | Excellent 5.1% |
| Immigrants | Panama | 83.0 /100 | #139 | Excellent 5.1% |
| Immigrants | Chile | 83.0 /100 | #140 | Excellent 5.1% |
| Cherokee | 81.6 /100 | #141 | Excellent 5.1% |
| Immigrants | Indonesia | 81.0 /100 | #142 | Excellent 5.1% |
| Senegalese | 80.4 /100 | #143 | Excellent 5.1% |
| Poles | 80.3 /100 | #144 | Excellent 5.1% |
| Spanish | 78.8 /100 | #145 | Good 5.1% |
| Immigrants | Russia | 78.5 /100 | #146 | Good 5.1% |
| Slovaks | 77.9 /100 | #147 | Good 5.1% |
| Greeks | 77.0 /100 | #148 | Good 5.1% |
| Immigrants | Afghanistan | 76.8 /100 | #149 | Good 5.1% |
| Immigrants | Asia | 75.6 /100 | #150 | Good 5.1% |
| Pakistanis | 75.5 /100 | #151 | Good 5.1% |
| Canadians | 74.7 /100 | #152 | Good 5.1% |
| Immigrants | Czechoslovakia | 74.5 /100 | #153 | Good 5.1% |
| Immigrants | Hong Kong | 74.0 /100 | #154 | Good 5.1% |
| Basques | 72.9 /100 | #155 | Good 5.1% |
| Immigrants | Romania | 72.4 /100 | #156 | Good 5.1% |
| Immigrants | Northern Europe | 69.8 /100 | #157 | Good 5.1% |
| Immigrants | Belarus | 69.0 /100 | #158 | Good 5.1% |