Immigrants from Chile vs Immigrants from Romania Male Unemployment
COMPARE
Immigrants from Chile
Immigrants from Romania
Male Unemployment
Male Unemployment Comparison
Immigrants from Chile
Immigrants from Romania
5.1%
MALE UNEMPLOYMENT
91.8/ 100
METRIC RATING
104th/ 347
METRIC RANK
5.1%
MALE UNEMPLOYMENT
95.4/ 100
METRIC RATING
87th/ 347
METRIC RANK
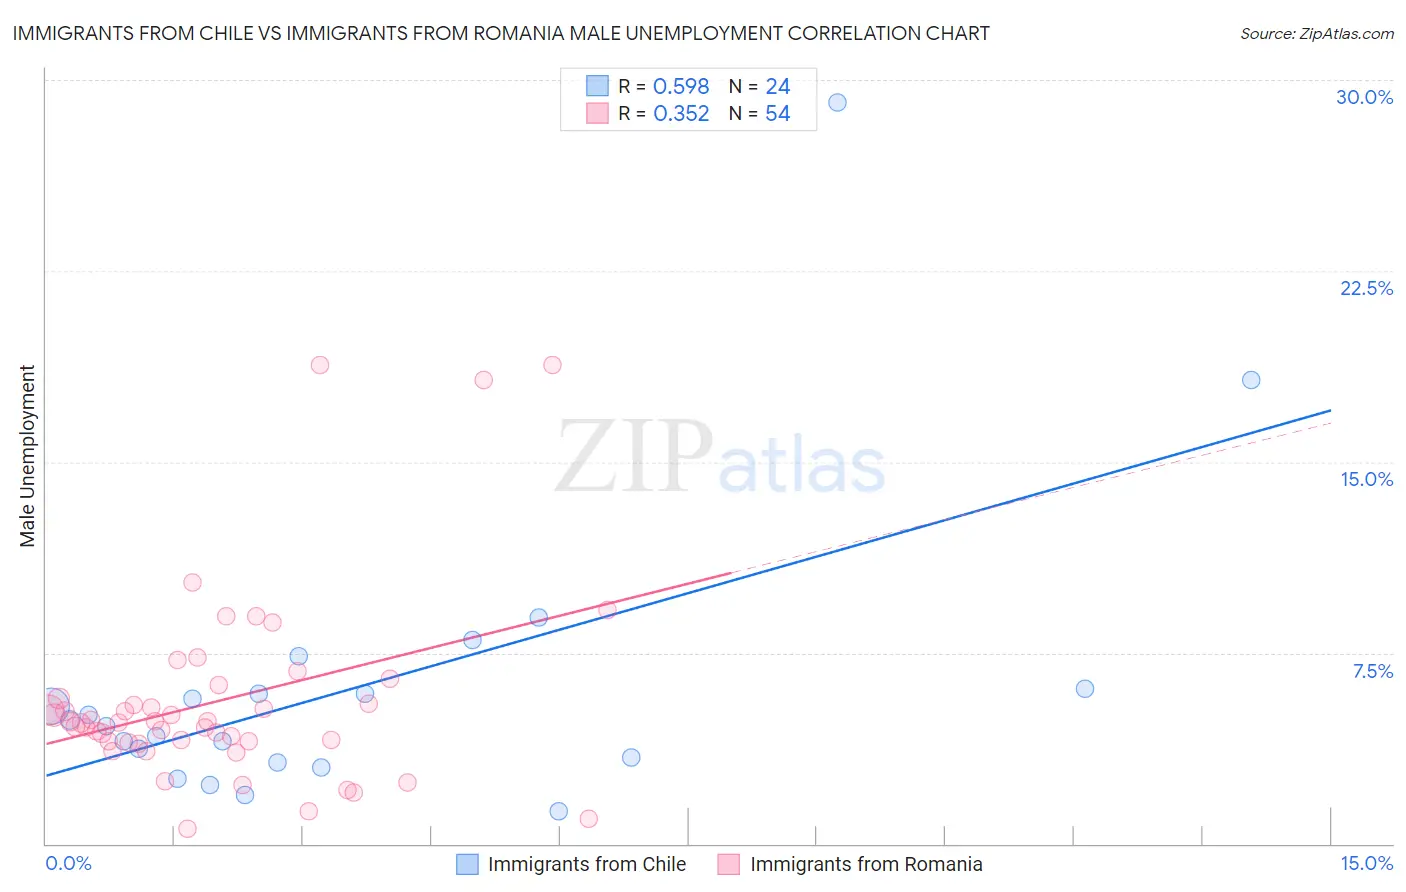
Immigrants from Chile vs Immigrants from Romania Male Unemployment Correlation Chart
The statistical analysis conducted on geographies consisting of 218,334,773 people shows a substantial positive correlation between the proportion of Immigrants from Chile and unemployment rate among males in the United States with a correlation coefficient (R) of 0.598 and weighted average of 5.1%. Similarly, the statistical analysis conducted on geographies consisting of 256,547,728 people shows a mild positive correlation between the proportion of Immigrants from Romania and unemployment rate among males in the United States with a correlation coefficient (R) of 0.352 and weighted average of 5.1%, a difference of 0.96%.
Male Unemployment Correlation Summary
| Measurement | Immigrants from Chile | Immigrants from Romania |
| Minimum | 1.3% | 0.60% |
| Maximum | 29.1% | 18.8% |
| Range | 27.8% | 18.2% |
| Mean | 6.2% | 5.6% |
| Median | 4.8% | 4.8% |
| Interquartile 25% (IQ1) | 3.3% | 4.0% |
| Interquartile 75% (IQ3) | 6.0% | 5.7% |
| Interquartile Range (IQR) | 2.7% | 1.7% |
| Standard Deviation (Sample) | 5.9% | 3.8% |
| Standard Deviation (Population) | 5.8% | 3.7% |
Demographics Similar to Immigrants from Chile and Immigrants from Romania by Male Unemployment
In terms of male unemployment, the demographic groups most similar to Immigrants from Chile are Immigrants from Czechoslovakia (5.1%, a difference of 0.010%), Immigrants from Jordan (5.1%, a difference of 0.030%), Immigrants from France (5.1%, a difference of 0.19%), German Russian (5.1%, a difference of 0.21%), and Russian (5.1%, a difference of 0.25%). Similarly, the demographic groups most similar to Immigrants from Romania are Maltese (5.1%, a difference of 0.020%), Immigrants from North Macedonia (5.1%, a difference of 0.060%), Immigrants from Sri Lanka (5.1%, a difference of 0.19%), Immigrants from Australia (5.1%, a difference of 0.22%), and Okinawan (5.1%, a difference of 0.23%).
| Demographics | Rating | Rank | Male Unemployment |
| Immigrants | North Macedonia | 95.6 /100 | #85 | Exceptional 5.1% |
| Maltese | 95.5 /100 | #86 | Exceptional 5.1% |
| Immigrants | Romania | 95.4 /100 | #87 | Exceptional 5.1% |
| Immigrants | Sri Lanka | 94.9 /100 | #88 | Exceptional 5.1% |
| Immigrants | Australia | 94.7 /100 | #89 | Exceptional 5.1% |
| Okinawans | 94.7 /100 | #90 | Exceptional 5.1% |
| Immigrants | Turkey | 94.4 /100 | #91 | Exceptional 5.1% |
| Slavs | 94.2 /100 | #92 | Exceptional 5.1% |
| Immigrants | Serbia | 94.2 /100 | #93 | Exceptional 5.1% |
| Canadians | 94.1 /100 | #94 | Exceptional 5.1% |
| Italians | 93.8 /100 | #95 | Exceptional 5.1% |
| Asians | 93.7 /100 | #96 | Exceptional 5.1% |
| Immigrants | Spain | 93.4 /100 | #97 | Exceptional 5.1% |
| Immigrants | Kuwait | 93.3 /100 | #98 | Exceptional 5.1% |
| Uruguayans | 93.0 /100 | #99 | Exceptional 5.1% |
| Russians | 92.9 /100 | #100 | Exceptional 5.1% |
| German Russians | 92.7 /100 | #101 | Exceptional 5.1% |
| Immigrants | France | 92.7 /100 | #102 | Exceptional 5.1% |
| Immigrants | Jordan | 91.9 /100 | #103 | Exceptional 5.1% |
| Immigrants | Chile | 91.8 /100 | #104 | Exceptional 5.1% |
| Immigrants | Czechoslovakia | 91.7 /100 | #105 | Exceptional 5.1% |