Immigrants from Caribbean vs Paiute In Labor Force | Age 25-29
COMPARE
Immigrants from Caribbean
Paiute
In Labor Force | Age 25-29
In Labor Force | Age 25-29 Comparison
Immigrants from Caribbean
Paiute
83.4%
IN LABOR FORCE | AGE 25-29
0.0/ 100
METRIC RATING
272nd/ 347
METRIC RANK
78.1%
IN LABOR FORCE | AGE 25-29
0.0/ 100
METRIC RATING
340th/ 347
METRIC RANK
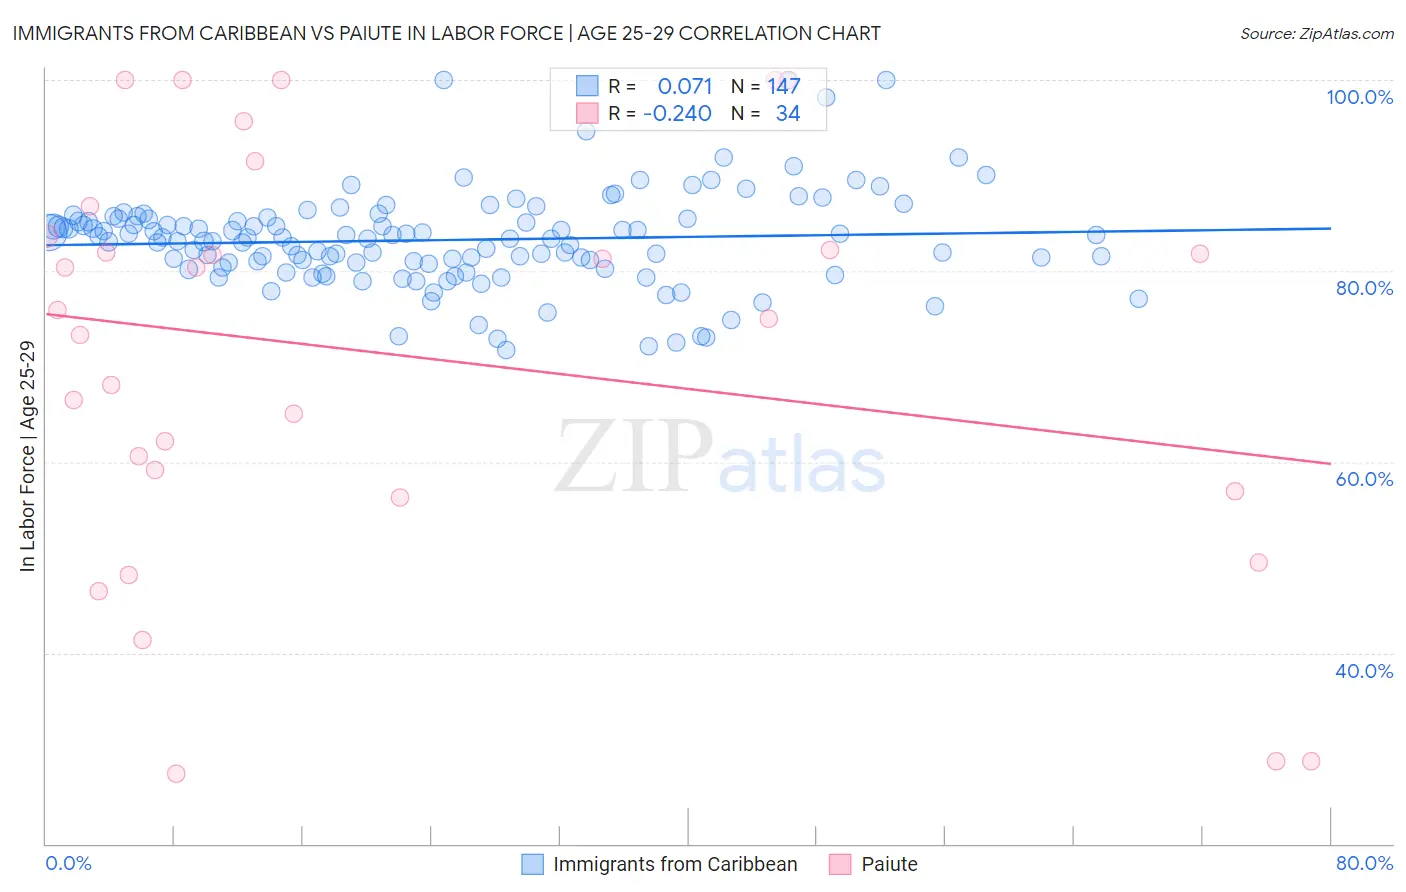
Immigrants from Caribbean vs Paiute In Labor Force | Age 25-29 Correlation Chart
The statistical analysis conducted on geographies consisting of 449,813,481 people shows a slight positive correlation between the proportion of Immigrants from Caribbean and labor force participation rate among population between the ages 25 and 29 in the United States with a correlation coefficient (R) of 0.071 and weighted average of 83.4%. Similarly, the statistical analysis conducted on geographies consisting of 58,387,082 people shows a weak negative correlation between the proportion of Paiute and labor force participation rate among population between the ages 25 and 29 in the United States with a correlation coefficient (R) of -0.240 and weighted average of 78.1%, a difference of 6.7%.
In Labor Force | Age 25-29 Correlation Summary
| Measurement | Immigrants from Caribbean | Paiute |
| Minimum | 71.7% | 27.3% |
| Maximum | 100.0% | 100.0% |
| Range | 28.3% | 72.7% |
| Mean | 83.2% | 71.1% |
| Median | 83.4% | 75.5% |
| Interquartile 25% (IQ1) | 80.8% | 56.9% |
| Interquartile 75% (IQ3) | 85.5% | 83.6% |
| Interquartile Range (IQR) | 4.7% | 26.7% |
| Standard Deviation (Sample) | 5.0% | 21.5% |
| Standard Deviation (Population) | 5.0% | 21.2% |
Similar Demographics by In Labor Force | Age 25-29
Demographics Similar to Immigrants from Caribbean by In Labor Force | Age 25-29
In terms of in labor force | age 25-29, the demographic groups most similar to Immigrants from Caribbean are Immigrants from Dominica (83.4%, a difference of 0.0%), Honduran (83.4%, a difference of 0.030%), Marshallese (83.3%, a difference of 0.030%), Basque (83.4%, a difference of 0.050%), and Immigrants from Lebanon (83.4%, a difference of 0.070%).
| Demographics | Rating | Rank | In Labor Force | Age 25-29 |
| Cubans | 0.1 /100 | #265 | Tragic 83.5% |
| Aleuts | 0.0 /100 | #266 | Tragic 83.4% |
| Spanish Americans | 0.0 /100 | #267 | Tragic 83.4% |
| Immigrants | Lebanon | 0.0 /100 | #268 | Tragic 83.4% |
| Immigrants | Barbados | 0.0 /100 | #269 | Tragic 83.4% |
| Basques | 0.0 /100 | #270 | Tragic 83.4% |
| Hondurans | 0.0 /100 | #271 | Tragic 83.4% |
| Immigrants | Caribbean | 0.0 /100 | #272 | Tragic 83.4% |
| Immigrants | Dominica | 0.0 /100 | #273 | Tragic 83.4% |
| Marshallese | 0.0 /100 | #274 | Tragic 83.3% |
| Samoans | 0.0 /100 | #275 | Tragic 83.3% |
| Immigrants | Honduras | 0.0 /100 | #276 | Tragic 83.3% |
| Africans | 0.0 /100 | #277 | Tragic 83.2% |
| Immigrants | Cuba | 0.0 /100 | #278 | Tragic 83.2% |
| British West Indians | 0.0 /100 | #279 | Tragic 83.2% |
Demographics Similar to Paiute by In Labor Force | Age 25-29
In terms of in labor force | age 25-29, the demographic groups most similar to Paiute are Immigrants from Yemen (78.2%, a difference of 0.16%), Lumbee (78.3%, a difference of 0.28%), Crow (78.6%, a difference of 0.65%), Tohono O'odham (77.5%, a difference of 0.78%), and Pueblo (77.5%, a difference of 0.80%).
| Demographics | Rating | Rank | In Labor Force | Age 25-29 |
| Sioux | 0.0 /100 | #333 | Tragic 79.7% |
| Yuman | 0.0 /100 | #334 | Tragic 79.3% |
| Natives/Alaskans | 0.0 /100 | #335 | Tragic 79.3% |
| Apache | 0.0 /100 | #336 | Tragic 79.2% |
| Crow | 0.0 /100 | #337 | Tragic 78.6% |
| Lumbee | 0.0 /100 | #338 | Tragic 78.3% |
| Immigrants | Yemen | 0.0 /100 | #339 | Tragic 78.2% |
| Paiute | 0.0 /100 | #340 | Tragic 78.1% |
| Tohono O'odham | 0.0 /100 | #341 | Tragic 77.5% |
| Pueblo | 0.0 /100 | #342 | Tragic 77.5% |
| Arapaho | 0.0 /100 | #343 | Tragic 76.6% |
| Hopi | 0.0 /100 | #344 | Tragic 76.5% |
| Navajo | 0.0 /100 | #345 | Tragic 74.6% |
| Pima | 0.0 /100 | #346 | Tragic 74.3% |
| Yup'ik | 0.0 /100 | #347 | Tragic 73.1% |