Immigrants from Caribbean vs Bulgarian In Labor Force | Age 25-29
COMPARE
Immigrants from Caribbean
Bulgarian
In Labor Force | Age 25-29
In Labor Force | Age 25-29 Comparison
Immigrants from Caribbean
Bulgarians
83.4%
IN LABOR FORCE | AGE 25-29
0.0/ 100
METRIC RATING
272nd/ 347
METRIC RANK
86.0%
IN LABOR FORCE | AGE 25-29
100.0/ 100
METRIC RATING
18th/ 347
METRIC RANK
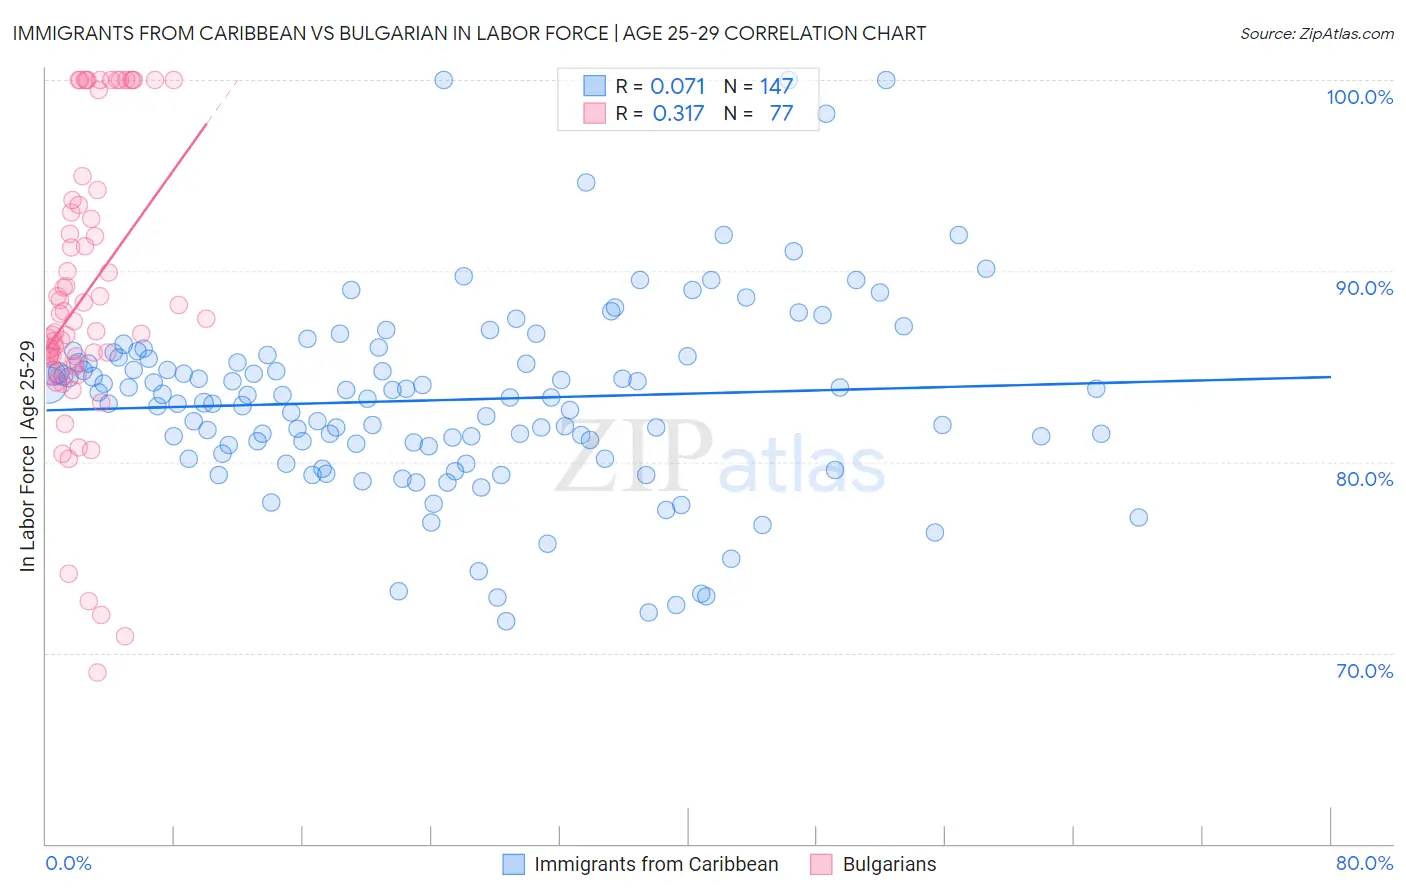
Immigrants from Caribbean vs Bulgarian In Labor Force | Age 25-29 Correlation Chart
The statistical analysis conducted on geographies consisting of 449,813,481 people shows a slight positive correlation between the proportion of Immigrants from Caribbean and labor force participation rate among population between the ages 25 and 29 in the United States with a correlation coefficient (R) of 0.071 and weighted average of 83.4%. Similarly, the statistical analysis conducted on geographies consisting of 205,601,422 people shows a mild positive correlation between the proportion of Bulgarians and labor force participation rate among population between the ages 25 and 29 in the United States with a correlation coefficient (R) of 0.317 and weighted average of 86.0%, a difference of 3.2%.
In Labor Force | Age 25-29 Correlation Summary
| Measurement | Immigrants from Caribbean | Bulgarian |
| Minimum | 71.7% | 69.0% |
| Maximum | 100.0% | 100.0% |
| Range | 28.3% | 31.0% |
| Mean | 83.2% | 88.8% |
| Median | 83.4% | 87.3% |
| Interquartile 25% (IQ1) | 80.8% | 85.3% |
| Interquartile 75% (IQ3) | 85.5% | 93.6% |
| Interquartile Range (IQR) | 4.7% | 8.3% |
| Standard Deviation (Sample) | 5.0% | 7.5% |
| Standard Deviation (Population) | 5.0% | 7.5% |
Similar Demographics by In Labor Force | Age 25-29
Demographics Similar to Immigrants from Caribbean by In Labor Force | Age 25-29
In terms of in labor force | age 25-29, the demographic groups most similar to Immigrants from Caribbean are Immigrants from Dominica (83.4%, a difference of 0.0%), Honduran (83.4%, a difference of 0.030%), Marshallese (83.3%, a difference of 0.030%), Basque (83.4%, a difference of 0.050%), and Immigrants from Lebanon (83.4%, a difference of 0.070%).
| Demographics | Rating | Rank | In Labor Force | Age 25-29 |
| Cubans | 0.1 /100 | #265 | Tragic 83.5% |
| Aleuts | 0.0 /100 | #266 | Tragic 83.4% |
| Spanish Americans | 0.0 /100 | #267 | Tragic 83.4% |
| Immigrants | Lebanon | 0.0 /100 | #268 | Tragic 83.4% |
| Immigrants | Barbados | 0.0 /100 | #269 | Tragic 83.4% |
| Basques | 0.0 /100 | #270 | Tragic 83.4% |
| Hondurans | 0.0 /100 | #271 | Tragic 83.4% |
| Immigrants | Caribbean | 0.0 /100 | #272 | Tragic 83.4% |
| Immigrants | Dominica | 0.0 /100 | #273 | Tragic 83.4% |
| Marshallese | 0.0 /100 | #274 | Tragic 83.3% |
| Samoans | 0.0 /100 | #275 | Tragic 83.3% |
| Immigrants | Honduras | 0.0 /100 | #276 | Tragic 83.3% |
| Africans | 0.0 /100 | #277 | Tragic 83.2% |
| Immigrants | Cuba | 0.0 /100 | #278 | Tragic 83.2% |
| British West Indians | 0.0 /100 | #279 | Tragic 83.2% |
Demographics Similar to Bulgarians by In Labor Force | Age 25-29
In terms of in labor force | age 25-29, the demographic groups most similar to Bulgarians are Cape Verdean (86.0%, a difference of 0.010%), Immigrants from Ireland (86.0%, a difference of 0.020%), Bermudan (86.0%, a difference of 0.030%), Maltese (86.0%, a difference of 0.030%), and Cambodian (86.0%, a difference of 0.040%).
| Demographics | Rating | Rank | In Labor Force | Age 25-29 |
| Immigrants | Ethiopia | 100.0 /100 | #11 | Exceptional 86.1% |
| Immigrants | Lithuania | 100.0 /100 | #12 | Exceptional 86.1% |
| Norwegians | 100.0 /100 | #13 | Exceptional 86.1% |
| Latvians | 100.0 /100 | #14 | Exceptional 86.1% |
| Bolivians | 100.0 /100 | #15 | Exceptional 86.1% |
| Immigrants | Bolivia | 100.0 /100 | #16 | Exceptional 86.1% |
| Bermudans | 100.0 /100 | #17 | Exceptional 86.0% |
| Bulgarians | 100.0 /100 | #18 | Exceptional 86.0% |
| Cape Verdeans | 100.0 /100 | #19 | Exceptional 86.0% |
| Immigrants | Ireland | 100.0 /100 | #20 | Exceptional 86.0% |
| Maltese | 100.0 /100 | #21 | Exceptional 86.0% |
| Cambodians | 100.0 /100 | #22 | Exceptional 86.0% |
| Immigrants | Uganda | 100.0 /100 | #23 | Exceptional 86.0% |
| Immigrants | Eastern Africa | 100.0 /100 | #24 | Exceptional 86.0% |
| Sudanese | 100.0 /100 | #25 | Exceptional 85.9% |