Immigrants from Caribbean vs Romanian In Labor Force | Age 35-44
COMPARE
Immigrants from Caribbean
Romanian
In Labor Force | Age 35-44
In Labor Force | Age 35-44 Comparison
Immigrants from Caribbean
Romanians
84.2%
IN LABOR FORCE | AGE 35-44
25.7/ 100
METRIC RATING
195th/ 347
METRIC RANK
84.5%
IN LABOR FORCE | AGE 35-44
72.1/ 100
METRIC RATING
151st/ 347
METRIC RANK
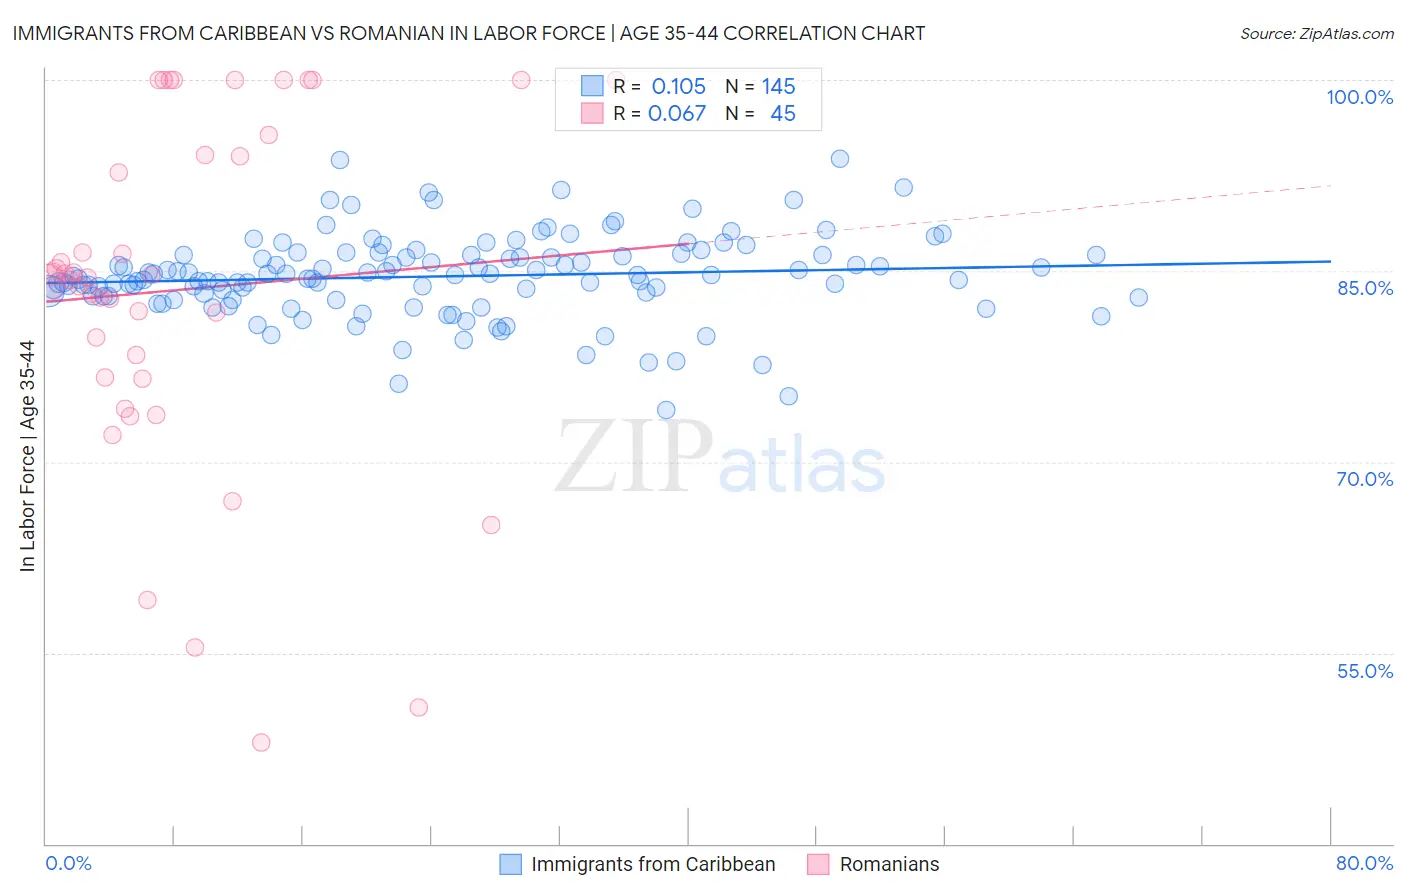
Immigrants from Caribbean vs Romanian In Labor Force | Age 35-44 Correlation Chart
The statistical analysis conducted on geographies consisting of 449,756,256 people shows a poor positive correlation between the proportion of Immigrants from Caribbean and labor force participation rate among population between the ages 35 and 44 in the United States with a correlation coefficient (R) of 0.105 and weighted average of 84.2%. Similarly, the statistical analysis conducted on geographies consisting of 377,740,706 people shows a slight positive correlation between the proportion of Romanians and labor force participation rate among population between the ages 35 and 44 in the United States with a correlation coefficient (R) of 0.067 and weighted average of 84.5%, a difference of 0.33%.
In Labor Force | Age 35-44 Correlation Summary
| Measurement | Immigrants from Caribbean | Romanian |
| Minimum | 74.1% | 48.0% |
| Maximum | 93.8% | 100.0% |
| Range | 19.7% | 52.0% |
| Mean | 84.6% | 83.5% |
| Median | 84.6% | 84.5% |
| Interquartile 25% (IQ1) | 83.0% | 76.6% |
| Interquartile 75% (IQ3) | 86.3% | 94.9% |
| Interquartile Range (IQR) | 3.3% | 18.3% |
| Standard Deviation (Sample) | 3.3% | 13.6% |
| Standard Deviation (Population) | 3.2% | 13.4% |
Similar Demographics by In Labor Force | Age 35-44
Demographics Similar to Immigrants from Caribbean by In Labor Force | Age 35-44
In terms of in labor force | age 35-44, the demographic groups most similar to Immigrants from Caribbean are Immigrants from Indonesia (84.2%, a difference of 0.0%), Immigrants from Vietnam (84.2%, a difference of 0.010%), Hungarian (84.2%, a difference of 0.010%), Immigrants from England (84.2%, a difference of 0.010%), and Immigrants from Western Europe (84.2%, a difference of 0.010%).
| Demographics | Rating | Rank | In Labor Force | Age 35-44 |
| South Africans | 34.1 /100 | #188 | Fair 84.3% |
| Immigrants | Denmark | 33.7 /100 | #189 | Fair 84.3% |
| Portuguese | 31.9 /100 | #190 | Fair 84.3% |
| Immigrants | Philippines | 27.9 /100 | #191 | Fair 84.2% |
| Immigrants | Vietnam | 27.4 /100 | #192 | Fair 84.2% |
| Hungarians | 26.8 /100 | #193 | Fair 84.2% |
| Immigrants | Indonesia | 25.7 /100 | #194 | Fair 84.2% |
| Immigrants | Caribbean | 25.7 /100 | #195 | Fair 84.2% |
| Immigrants | England | 25.0 /100 | #196 | Fair 84.2% |
| Immigrants | Western Europe | 24.7 /100 | #197 | Fair 84.2% |
| Ecuadorians | 24.0 /100 | #198 | Fair 84.2% |
| Syrians | 23.2 /100 | #199 | Fair 84.2% |
| Moroccans | 23.2 /100 | #200 | Fair 84.2% |
| British | 23.0 /100 | #201 | Fair 84.2% |
| Immigrants | Uzbekistan | 22.8 /100 | #202 | Fair 84.2% |
Demographics Similar to Romanians by In Labor Force | Age 35-44
In terms of in labor force | age 35-44, the demographic groups most similar to Romanians are South American Indian (84.5%, a difference of 0.010%), Okinawan (84.5%, a difference of 0.010%), Immigrants from Nigeria (84.5%, a difference of 0.010%), Immigrants from Taiwan (84.5%, a difference of 0.010%), and Trinidadian and Tobagonian (84.5%, a difference of 0.020%).
| Demographics | Rating | Rank | In Labor Force | Age 35-44 |
| Immigrants | Jamaica | 79.4 /100 | #144 | Good 84.6% |
| Immigrants | Saudi Arabia | 79.4 /100 | #145 | Good 84.6% |
| Immigrants | Asia | 78.7 /100 | #146 | Good 84.5% |
| Immigrants | Netherlands | 76.6 /100 | #147 | Good 84.5% |
| South American Indians | 73.6 /100 | #148 | Good 84.5% |
| Okinawans | 73.5 /100 | #149 | Good 84.5% |
| Immigrants | Nigeria | 73.3 /100 | #150 | Good 84.5% |
| Romanians | 72.1 /100 | #151 | Good 84.5% |
| Immigrants | Taiwan | 71.4 /100 | #152 | Good 84.5% |
| Trinidadians and Tobagonians | 69.5 /100 | #153 | Good 84.5% |
| Iranians | 69.4 /100 | #154 | Good 84.5% |
| Immigrants | Switzerland | 65.9 /100 | #155 | Good 84.5% |
| Immigrants | Israel | 64.3 /100 | #156 | Good 84.4% |
| Immigrants | Austria | 63.8 /100 | #157 | Good 84.4% |
| Jamaicans | 62.7 /100 | #158 | Good 84.4% |