Immigrants from Caribbean vs Croatian In Labor Force | Age 35-44
COMPARE
Immigrants from Caribbean
Croatian
In Labor Force | Age 35-44
In Labor Force | Age 35-44 Comparison
Immigrants from Caribbean
Croatians
84.2%
IN LABOR FORCE | AGE 35-44
25.7/ 100
METRIC RATING
195th/ 347
METRIC RANK
85.2%
IN LABOR FORCE | AGE 35-44
99.7/ 100
METRIC RATING
49th/ 347
METRIC RANK
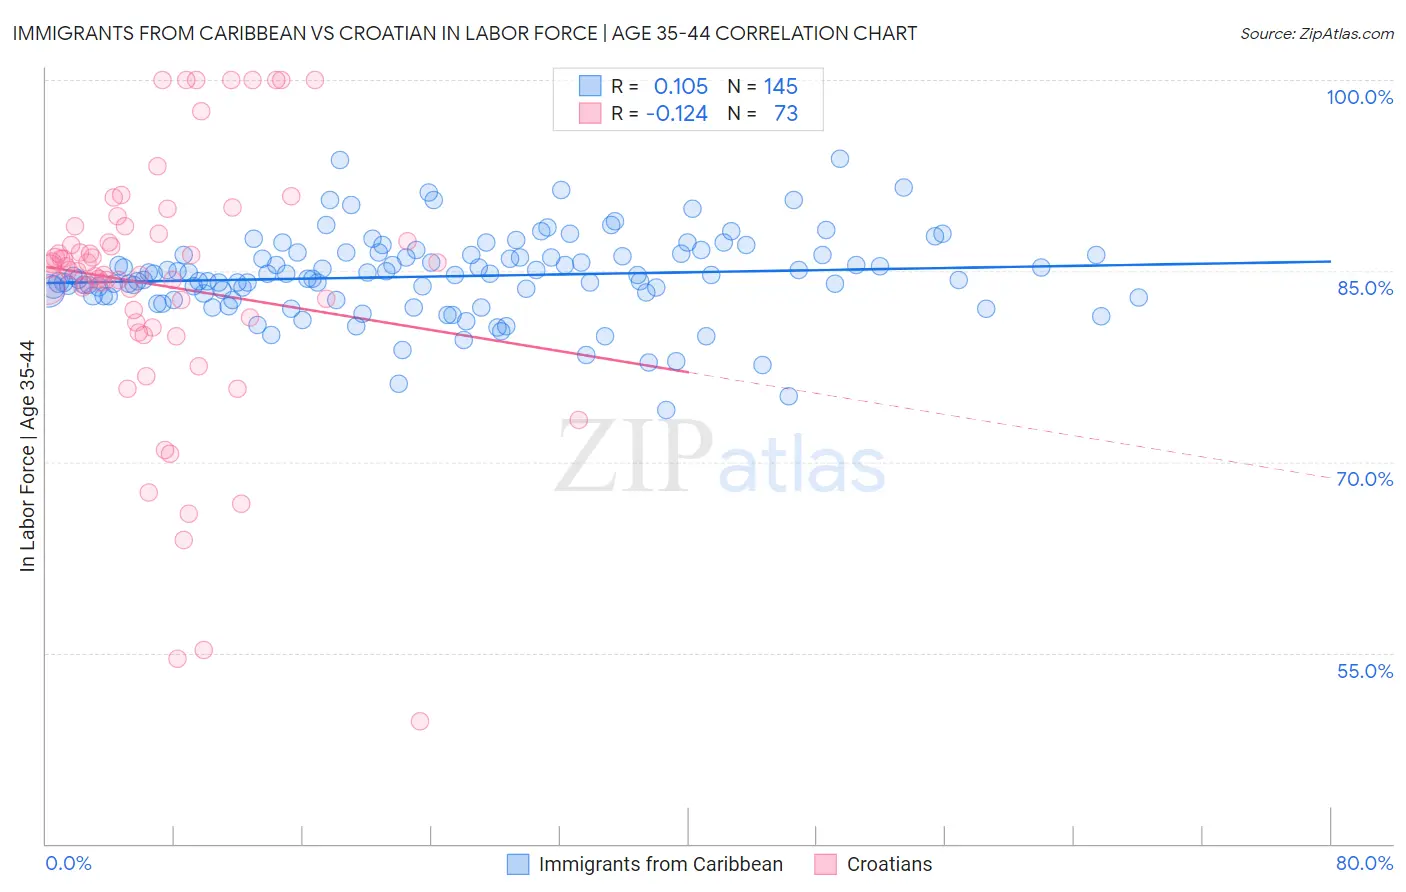
Immigrants from Caribbean vs Croatian In Labor Force | Age 35-44 Correlation Chart
The statistical analysis conducted on geographies consisting of 449,756,256 people shows a poor positive correlation between the proportion of Immigrants from Caribbean and labor force participation rate among population between the ages 35 and 44 in the United States with a correlation coefficient (R) of 0.105 and weighted average of 84.2%. Similarly, the statistical analysis conducted on geographies consisting of 375,572,294 people shows a poor negative correlation between the proportion of Croatians and labor force participation rate among population between the ages 35 and 44 in the United States with a correlation coefficient (R) of -0.124 and weighted average of 85.2%, a difference of 1.1%.
In Labor Force | Age 35-44 Correlation Summary
| Measurement | Immigrants from Caribbean | Croatian |
| Minimum | 74.1% | 49.6% |
| Maximum | 93.8% | 100.0% |
| Range | 19.7% | 50.4% |
| Mean | 84.6% | 83.8% |
| Median | 84.6% | 85.0% |
| Interquartile 25% (IQ1) | 83.0% | 80.8% |
| Interquartile 75% (IQ3) | 86.3% | 88.2% |
| Interquartile Range (IQR) | 3.3% | 7.5% |
| Standard Deviation (Sample) | 3.3% | 10.3% |
| Standard Deviation (Population) | 3.2% | 10.2% |
Similar Demographics by In Labor Force | Age 35-44
Demographics Similar to Immigrants from Caribbean by In Labor Force | Age 35-44
In terms of in labor force | age 35-44, the demographic groups most similar to Immigrants from Caribbean are Immigrants from Indonesia (84.2%, a difference of 0.0%), Immigrants from Vietnam (84.2%, a difference of 0.010%), Hungarian (84.2%, a difference of 0.010%), Immigrants from England (84.2%, a difference of 0.010%), and Immigrants from Western Europe (84.2%, a difference of 0.010%).
| Demographics | Rating | Rank | In Labor Force | Age 35-44 |
| South Africans | 34.1 /100 | #188 | Fair 84.3% |
| Immigrants | Denmark | 33.7 /100 | #189 | Fair 84.3% |
| Portuguese | 31.9 /100 | #190 | Fair 84.3% |
| Immigrants | Philippines | 27.9 /100 | #191 | Fair 84.2% |
| Immigrants | Vietnam | 27.4 /100 | #192 | Fair 84.2% |
| Hungarians | 26.8 /100 | #193 | Fair 84.2% |
| Immigrants | Indonesia | 25.7 /100 | #194 | Fair 84.2% |
| Immigrants | Caribbean | 25.7 /100 | #195 | Fair 84.2% |
| Immigrants | England | 25.0 /100 | #196 | Fair 84.2% |
| Immigrants | Western Europe | 24.7 /100 | #197 | Fair 84.2% |
| Ecuadorians | 24.0 /100 | #198 | Fair 84.2% |
| Syrians | 23.2 /100 | #199 | Fair 84.2% |
| Moroccans | 23.2 /100 | #200 | Fair 84.2% |
| British | 23.0 /100 | #201 | Fair 84.2% |
| Immigrants | Uzbekistan | 22.8 /100 | #202 | Fair 84.2% |
Demographics Similar to Croatians by In Labor Force | Age 35-44
In terms of in labor force | age 35-44, the demographic groups most similar to Croatians are Immigrants from Eritrea (85.2%, a difference of 0.0%), German Russian (85.2%, a difference of 0.010%), Immigrants from Hong Kong (85.2%, a difference of 0.020%), Cypriot (85.2%, a difference of 0.030%), and Thai (85.2%, a difference of 0.030%).
| Demographics | Rating | Rank | In Labor Force | Age 35-44 |
| Macedonians | 99.8 /100 | #42 | Exceptional 85.2% |
| Poles | 99.8 /100 | #43 | Exceptional 85.2% |
| Lithuanians | 99.8 /100 | #44 | Exceptional 85.2% |
| Cypriots | 99.8 /100 | #45 | Exceptional 85.2% |
| Immigrants | Hong Kong | 99.8 /100 | #46 | Exceptional 85.2% |
| German Russians | 99.8 /100 | #47 | Exceptional 85.2% |
| Immigrants | Eritrea | 99.7 /100 | #48 | Exceptional 85.2% |
| Croatians | 99.7 /100 | #49 | Exceptional 85.2% |
| Thais | 99.7 /100 | #50 | Exceptional 85.2% |
| Immigrants | Albania | 99.7 /100 | #51 | Exceptional 85.1% |
| Immigrants | Kenya | 99.6 /100 | #52 | Exceptional 85.1% |
| Taiwanese | 99.6 /100 | #53 | Exceptional 85.1% |
| Turks | 99.5 /100 | #54 | Exceptional 85.1% |
| Soviet Union | 99.5 /100 | #55 | Exceptional 85.1% |
| Immigrants | Croatia | 99.5 /100 | #56 | Exceptional 85.1% |