Immigrants from Canada vs Uruguayan Family Households with Children
COMPARE
Immigrants from Canada
Uruguayan
Family Households with Children
Family Households with Children Comparison
Immigrants from Canada
Uruguayans
26.5%
FAMILY HOUSEHOLDS WITH CHILDREN
0.3/ 100
METRIC RATING
284th/ 347
METRIC RANK
27.7%
FAMILY HOUSEHOLDS WITH CHILDREN
83.2/ 100
METRIC RATING
138th/ 347
METRIC RANK
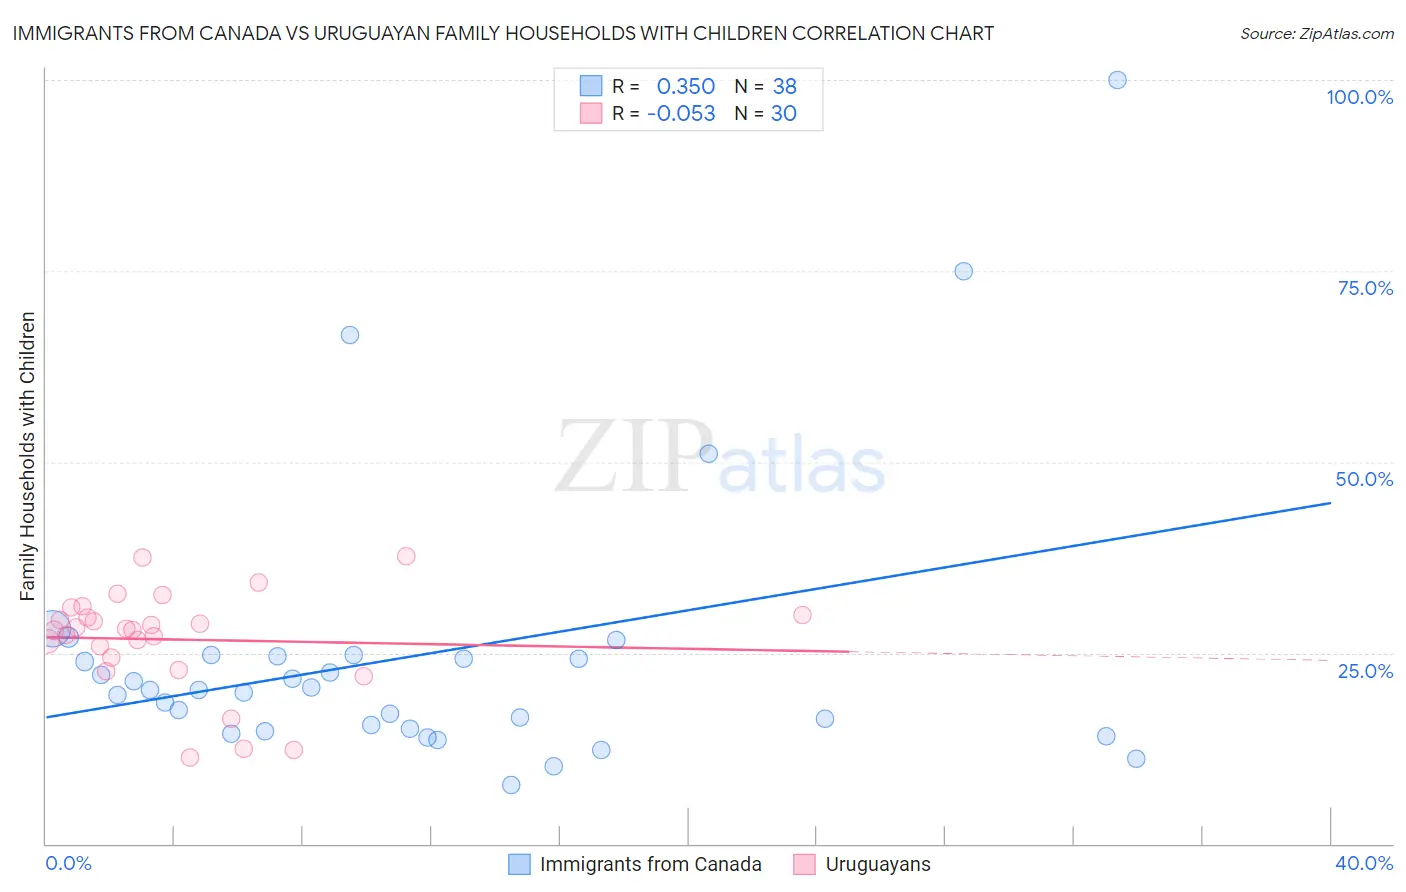
Immigrants from Canada vs Uruguayan Family Households with Children Correlation Chart
The statistical analysis conducted on geographies consisting of 458,900,901 people shows a mild positive correlation between the proportion of Immigrants from Canada and percentage of family households with children in the United States with a correlation coefficient (R) of 0.350 and weighted average of 26.5%. Similarly, the statistical analysis conducted on geographies consisting of 144,747,065 people shows a slight negative correlation between the proportion of Uruguayans and percentage of family households with children in the United States with a correlation coefficient (R) of -0.053 and weighted average of 27.7%, a difference of 4.3%.
Family Households with Children Correlation Summary
| Measurement | Immigrants from Canada | Uruguayan |
| Minimum | 7.6% | 11.3% |
| Maximum | 100.0% | 37.6% |
| Range | 92.4% | 26.4% |
| Mean | 24.6% | 26.7% |
| Median | 20.1% | 28.0% |
| Interquartile 25% (IQ1) | 15.0% | 24.4% |
| Interquartile 75% (IQ3) | 24.6% | 30.0% |
| Interquartile Range (IQR) | 9.6% | 5.6% |
| Standard Deviation (Sample) | 18.5% | 6.6% |
| Standard Deviation (Population) | 18.3% | 6.5% |
Similar Demographics by Family Households with Children
Demographics Similar to Immigrants from Canada by Family Households with Children
In terms of family households with children, the demographic groups most similar to Immigrants from Canada are Immigrants from North America (26.6%, a difference of 0.020%), Cambodian (26.5%, a difference of 0.030%), Immigrants from Senegal (26.5%, a difference of 0.080%), French American Indian (26.6%, a difference of 0.090%), and Shoshone (26.5%, a difference of 0.090%).
| Demographics | Rating | Rank | Family Households with Children |
| Celtics | 0.4 /100 | #277 | Tragic 26.6% |
| Immigrants | Europe | 0.4 /100 | #278 | Tragic 26.6% |
| Finns | 0.4 /100 | #279 | Tragic 26.6% |
| Senegalese | 0.4 /100 | #280 | Tragic 26.6% |
| Lithuanians | 0.3 /100 | #281 | Tragic 26.6% |
| French American Indians | 0.3 /100 | #282 | Tragic 26.6% |
| Immigrants | North America | 0.3 /100 | #283 | Tragic 26.6% |
| Immigrants | Canada | 0.3 /100 | #284 | Tragic 26.5% |
| Cambodians | 0.2 /100 | #285 | Tragic 26.5% |
| Immigrants | Senegal | 0.2 /100 | #286 | Tragic 26.5% |
| Shoshone | 0.2 /100 | #287 | Tragic 26.5% |
| Russians | 0.2 /100 | #288 | Tragic 26.5% |
| Immigrants | Sweden | 0.2 /100 | #289 | Tragic 26.5% |
| Albanians | 0.2 /100 | #290 | Tragic 26.5% |
| Bahamians | 0.2 /100 | #291 | Tragic 26.5% |
Demographics Similar to Uruguayans by Family Households with Children
In terms of family households with children, the demographic groups most similar to Uruguayans are Vietnamese (27.7%, a difference of 0.020%), Immigrants from Dominican Republic (27.7%, a difference of 0.030%), Immigrants from Portugal (27.7%, a difference of 0.040%), Spanish (27.7%, a difference of 0.050%), and Immigrants from Ecuador (27.7%, a difference of 0.060%).
| Demographics | Rating | Rank | Family Households with Children |
| Lebanese | 87.4 /100 | #131 | Excellent 27.7% |
| Immigrants | Belize | 85.7 /100 | #132 | Excellent 27.7% |
| Iranians | 85.2 /100 | #133 | Excellent 27.7% |
| Immigrants | Panama | 84.9 /100 | #134 | Excellent 27.7% |
| Immigrants | Ecuador | 84.6 /100 | #135 | Excellent 27.7% |
| Immigrants | Portugal | 84.1 /100 | #136 | Excellent 27.7% |
| Immigrants | Dominican Republic | 83.9 /100 | #137 | Excellent 27.7% |
| Uruguayans | 83.2 /100 | #138 | Excellent 27.7% |
| Vietnamese | 82.6 /100 | #139 | Excellent 27.7% |
| Spanish | 81.8 /100 | #140 | Excellent 27.7% |
| Immigrants | Eastern Asia | 81.7 /100 | #141 | Excellent 27.7% |
| Swiss | 81.4 /100 | #142 | Excellent 27.7% |
| Immigrants | Eastern Africa | 80.2 /100 | #143 | Excellent 27.7% |
| Brazilians | 79.6 /100 | #144 | Good 27.7% |
| Immigrants | Chile | 79.5 /100 | #145 | Good 27.7% |