Immigrants from Canada vs Immigrants from Middle Africa Unemployment

COMPARE

Immigrants from Canada
Race
Ancestry
AfghanAfricanAlaska NativeAlaskan AthabascanAlbanianAleutAlsatianAmericanApacheArabArapahoArgentineanArmenianAssyrian/Chaldean/SyriacAustralianAustrianBahamianBangladeshiBarbadianBasqueBelgianBelizeanBermudanBhutaneseBlackfeetBolivianBrazilianBritishBritish West IndianBulgarianBurmeseCajunCambodianCanadianCape VerdeanCarpatho RusynCelticCentral AmericanCentral American IndianCherokeeCheyenneChickasawChileanChineseChippewaChoctawColombianColvilleComancheCosta RicanCreeCreekCroatianCrowCubanCypriotCzechCzechoslovakianDanishDelawareDominicanDutchDutch West IndianEastern EuropeanEcuadorianEgyptianEnglishEstonianEthiopianEuropeanFijianFilipinoFinnishFrenchFrench American IndianFrench CanadianGermanGerman RussianGhanaianGreekGuamanian/ChamorroGuatemalanGuyaneseHaitianHmongHonduranHopiHoumaHungarianIcelanderIndian (Asian)IndonesianInupiatIranianIraqiIrishIroquoisIsraeliItalianJamaicanJapaneseJordanianKenyanKiowaKoreanLaotianLatvianLebaneseLiberianLithuanianLumbeeLuxembourgerMacedonianMalaysianMalteseMarshalleseMenomineeMexicanMexican American IndianMongolianMoroccanNative HawaiianNavajoNepaleseNew ZealanderNicaraguanNigerianNorthern EuropeanNorwegianOkinawanOsageOttawaPaiutePakistaniPalestinianPanamanianParaguayanPennsylvania GermanPeruvianPimaPolishPortuguesePotawatomiPuebloPuerto RicanPuget Sound SalishRomanianRussianSalvadoranSamoanScandinavianScotch-IrishScottishSeminoleSenegaleseSerbianShoshoneSierra LeoneanSiouxSlavicSlovakSloveneSomaliSouth AfricanSouth AmericanSouth American IndianSoviet UnionSpaniardSpanishSpanish AmericanSpanish American IndianSri LankanSubsaharan AfricanSudaneseSwedishSwissSyrianTaiwaneseThaiTlingit-HaidaTohono O'OdhamTonganTrinidadian and TobagonianTsimshianTurkishU.S. Virgin IslanderUgandanUkrainianUruguayanUteVenezuelanVietnameseWelshWest IndianYakamaYaquiYugoslavianYumanYup'ikZimbabwean
Immigration
NonimmigrantsImmigrantsAfghanistanAfricaAlbaniaArgentinaArmeniaAsiaAustraliaAustriaBahamasBangladeshBarbadosBelarusBelgiumBelizeBoliviaBosnia and HerzegovinaBrazilBulgariaBurma/MyanmarCabo VerdeCambodiaCameroonCanadaCaribbeanCentral AmericaChileChinaColombiaCongoCosta RicaCroatiaCubaCzechoslovakiaDenmarkDominicaDominican RepublicEastern AfricaEastern AsiaEastern EuropeEcuadorEgyptEl SalvadorEnglandEritreaEthiopiaEuropeFijiFranceGermanyGhanaGreeceGrenadaGuatemalaGuyanaHaitiHondurasHong KongHungaryIndiaIndonesiaIranIraqIrelandIsraelItalyJamaicaJapanJordanKazakhstanKenyaKoreaKuwaitLaosLatin AmericaLatviaLebanonLiberiaLithuaniaMalaysiaMexicoMicronesiaMoldovaMoroccoNepalNetherlandsNicaraguaNigeriaNorth AmericaNorth MacedoniaNorthern AfricaNorthern EuropeNorwayOceaniaPakistanPanamaPeruPhilippinesPolandPortugalRomaniaRussiaSaudi ArabiaScotlandSenegalSerbiaSierra LeoneSingaporeSomaliaSouth AfricaSouth AmericaSouth Central AsiaSouth Eastern AsiaSouthern EuropeSpainSri LankaSt. Vincent and the GrenadinesSudanSwedenSwitzerlandSyriaTaiwanThailandTrinidad and TobagoTurkeyUgandaUkraineUruguayUzbekistanVenezuelaVietnamWest IndiesWestern AfricaWestern AsiaWestern EuropeYemenZaireZimbabweAzores
Immigrants from Middle Africa
Race
Ancestry
AfghanAfricanAlaska NativeAlaskan AthabascanAlbanianAleutAlsatianAmericanApacheArabArapahoArgentineanArmenianAssyrian/Chaldean/SyriacAustralianAustrianBahamianBangladeshiBarbadianBasqueBelgianBelizeanBermudanBhutaneseBlackfeetBolivianBrazilianBritishBritish West IndianBulgarianBurmeseCajunCambodianCanadianCape VerdeanCarpatho RusynCelticCentral AmericanCentral American IndianCherokeeCheyenneChickasawChileanChineseChippewaChoctawColombianColvilleComancheCosta RicanCreeCreekCroatianCrowCubanCypriotCzechCzechoslovakianDanishDelawareDominicanDutchDutch West IndianEastern EuropeanEcuadorianEgyptianEnglishEstonianEthiopianEuropeanFijianFilipinoFinnishFrenchFrench American IndianFrench CanadianGermanGerman RussianGhanaianGreekGuamanian/ChamorroGuatemalanGuyaneseHaitianHmongHonduranHopiHoumaHungarianIcelanderIndian (Asian)IndonesianInupiatIranianIraqiIrishIroquoisIsraeliItalianJamaicanJapaneseJordanianKenyanKiowaKoreanLaotianLatvianLebaneseLiberianLithuanianLumbeeLuxembourgerMacedonianMalaysianMalteseMarshalleseMenomineeMexicanMexican American IndianMongolianMoroccanNative HawaiianNavajoNepaleseNew ZealanderNicaraguanNigerianNorthern EuropeanNorwegianOkinawanOsageOttawaPaiutePakistaniPalestinianPanamanianParaguayanPennsylvania GermanPeruvianPimaPolishPortuguesePotawatomiPuebloPuerto RicanPuget Sound SalishRomanianRussianSalvadoranSamoanScandinavianScotch-IrishScottishSeminoleSenegaleseSerbianShoshoneSierra LeoneanSiouxSlavicSlovakSloveneSomaliSouth AfricanSouth AmericanSouth American IndianSoviet UnionSpaniardSpanishSpanish AmericanSpanish American IndianSri LankanSubsaharan AfricanSudaneseSwedishSwissSyrianTaiwaneseThaiTlingit-HaidaTohono O'OdhamTonganTrinidadian and TobagonianTsimshianTurkishU.S. Virgin IslanderUgandanUkrainianUruguayanUteVenezuelanVietnameseWelshWest IndianYakamaYaquiYugoslavianYumanYup'ikZimbabwean
Immigration
NonimmigrantsImmigrantsAfghanistanAfricaAlbaniaArgentinaArmeniaAsiaAustraliaAustriaBahamasBangladeshBarbadosBelarusBelgiumBelizeBoliviaBosnia and HerzegovinaBrazilBulgariaBurma/MyanmarCabo VerdeCambodiaCameroonCaribbeanCentral AmericaChileChinaColombiaCongoCosta RicaCroatiaCubaCzechoslovakiaDenmarkDominicaDominican RepublicEastern AfricaEastern AsiaEastern EuropeEcuadorEgyptEl SalvadorEnglandEritreaEthiopiaEuropeFijiFranceGermanyGhanaGreeceGrenadaGuatemalaGuyanaHaitiHondurasHong KongHungaryIndiaIndonesiaIranIraqIrelandIsraelItalyJamaicaJapanJordanKazakhstanKenyaKoreaKuwaitLaosLatin AmericaLatviaLebanonLiberiaLithuaniaMalaysiaMexicoMicronesiaMiddle AfricaMoldovaMoroccoNepalNetherlandsNicaraguaNigeriaNorth AmericaNorth MacedoniaNorthern AfricaNorthern EuropeNorwayOceaniaPakistanPanamaPeruPhilippinesPolandPortugalRomaniaRussiaSaudi ArabiaScotlandSenegalSerbiaSierra LeoneSingaporeSomaliaSouth AfricaSouth AmericaSouth Central AsiaSouth Eastern AsiaSouthern EuropeSpainSri LankaSt. Vincent and the GrenadinesSudanSwedenSwitzerlandSyriaTaiwanThailandTrinidad and TobagoTurkeyUgandaUkraineUruguayUzbekistanVenezuelaVietnamWest IndiesWestern AfricaWestern AsiaWestern EuropeYemenZaireZimbabweAzores
Unemployment
Income
Poverty
Unemployment
Labor Participation
Family Structure
Vehicle Availability
Education Level
Disability

Unemployment Comparison

Immigrants from Canada

Immigrants from Middle Africa

Exceptional
Poor
4.9%
UNEMPLOYMENT
98.8/ 100
METRIC RATING
65th/ 347
METRIC RANK
5.4%
UNEMPLOYMENT
15.3/ 100
METRIC RATING
213th/ 347
METRIC RANK

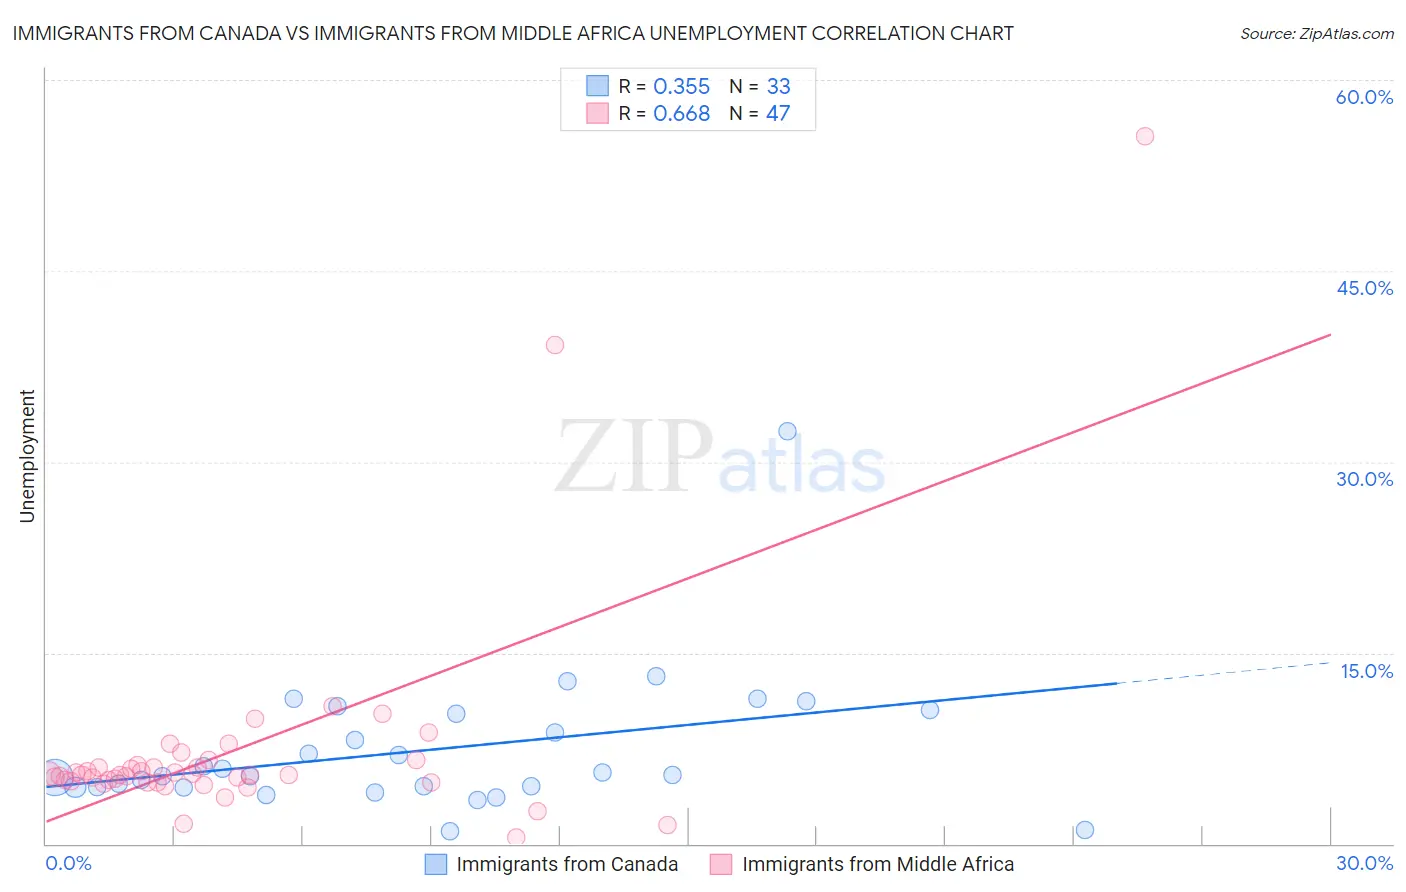
Immigrants from Canada vs Immigrants from Middle Africa Unemployment Correlation Chart

The statistical analysis conducted on geographies consisting of 458,510,369 people shows a mild positive correlation between the proportion of Immigrants from Canada and unemployment in the United States with a correlation coefficient (R) of 0.355 and weighted average of 4.9%. Similarly, the statistical analysis conducted on geographies consisting of 202,675,863 people shows a significant positive correlation between the proportion of Immigrants from Middle Africa and unemployment in the United States with a correlation coefficient (R) of 0.668 and weighted average of 5.4%, a difference of 10.1%.
Immigrants from Canada vs Immigrants from Middle Africa Unemployment

Unemployment Correlation Summary

MeasurementImmigrants from CanadaImmigrants from Middle Africa
Minimum1.0%0.50%
Maximum32.4%55.6%
Range31.4%55.1%
Mean7.4%7.3%
Median5.4%5.4%
Interquartile 25% (IQ1)4.4%4.8%
Interquartile 75% (IQ3)10.4%6.1%
Interquartile Range (IQR)5.9%1.3%
Standard Deviation (Sample)5.5%8.9%
Standard Deviation (Population)5.5%8.8%

Similar Demographics by Unemployment

Demographics Similar to Immigrants from Canada by Unemployment

In terms of unemployment, the demographic groups most similar to Immigrants from Canada are Italian (4.9%, a difference of 0.14%), Slovak (4.9%, a difference of 0.15%), New Zealander (4.9%, a difference of 0.19%), Slavic (4.9%, a difference of 0.22%), and Immigrants from Bulgaria (4.9%, a difference of 0.23%).
DemographicsRating | RankUnemployment
Greeks
99.0
/100
|
#58
Exceptional
4.9%
Bhutanese
99.0
/100
|
#59
Exceptional
4.9%
Immigrants | Netherlands
99.0
/100
|
#60
Exceptional
4.9%
Cambodians
99.0
/100
|
#61
Exceptional
4.9%
Icelanders
98.9
/100
|
#62
Exceptional
4.9%
Immigrants | Bulgaria
98.9
/100
|
#63
Exceptional
4.9%
Italians
98.9
/100
|
#64
Exceptional
4.9%
Immigrants | Canada
98.8
/100
|
#65
Exceptional
4.9%
Slovaks
98.7
/100
|
#66
Exceptional
4.9%
New Zealanders
98.6
/100
|
#67
Exceptional
4.9%
Slavs
98.6
/100
|
#68
Exceptional
4.9%
Immigrants | North America
98.5
/100
|
#69
Exceptional
4.9%
Serbians
98.4
/100
|
#70
Exceptional
4.9%
Immigrants | Japan
98.3
/100
|
#71
Exceptional
4.9%
Burmese
98.3
/100
|
#72
Exceptional
4.9%

Demographics Similar to Immigrants from Middle Africa by Unemployment

In terms of unemployment, the demographic groups most similar to Immigrants from Middle Africa are Immigrants from Costa Rica (5.4%, a difference of 0.0%), Delaware (5.4%, a difference of 0.060%), Immigrants from South America (5.4%, a difference of 0.22%), Immigrants from Albania (5.4%, a difference of 0.22%), and Ugandan (5.4%, a difference of 0.29%).
DemographicsRating | RankUnemployment
Immigrants | Peru
22.7
/100
|
#206
Fair
5.4%
Creek
19.4
/100
|
#207
Poor
5.4%
Portuguese
19.0
/100
|
#208
Poor
5.4%
Immigrants | Iran
18.8
/100
|
#209
Poor
5.4%
Immigrants | Iraq
18.6
/100
|
#210
Poor
5.4%
Iraqis
18.1
/100
|
#211
Poor
5.4%
Ugandans
18.0
/100
|
#212
Poor
5.4%
Immigrants | Middle Africa
15.3
/100
|
#213
Poor
5.4%
Immigrants | Costa Rica
15.2
/100
|
#214
Poor
5.4%
Delaware
14.7
/100
|
#215
Poor
5.4%
Immigrants | South America
13.5
/100
|
#216
Poor
5.4%
Immigrants | Albania
13.5
/100
|
#217
Poor
5.4%
Choctaw
12.7
/100
|
#218
Poor
5.4%
Bangladeshis
11.2
/100
|
#219
Poor
5.4%
Soviet Union
10.6
/100
|
#220
Poor
5.4%