Immigrants from Cameroon vs Scottish In Labor Force | Age > 16
COMPARE
Immigrants from Cameroon
Scottish
In Labor Force | Age > 16
In Labor Force | Age > 16 Comparison
Immigrants from Cameroon
Scottish
68.7%
IN LABOR FORCE | AGE > 16
100.0/ 100
METRIC RATING
7th/ 347
METRIC RANK
63.9%
IN LABOR FORCE | AGE > 16
0.1/ 100
METRIC RATING
287th/ 347
METRIC RANK
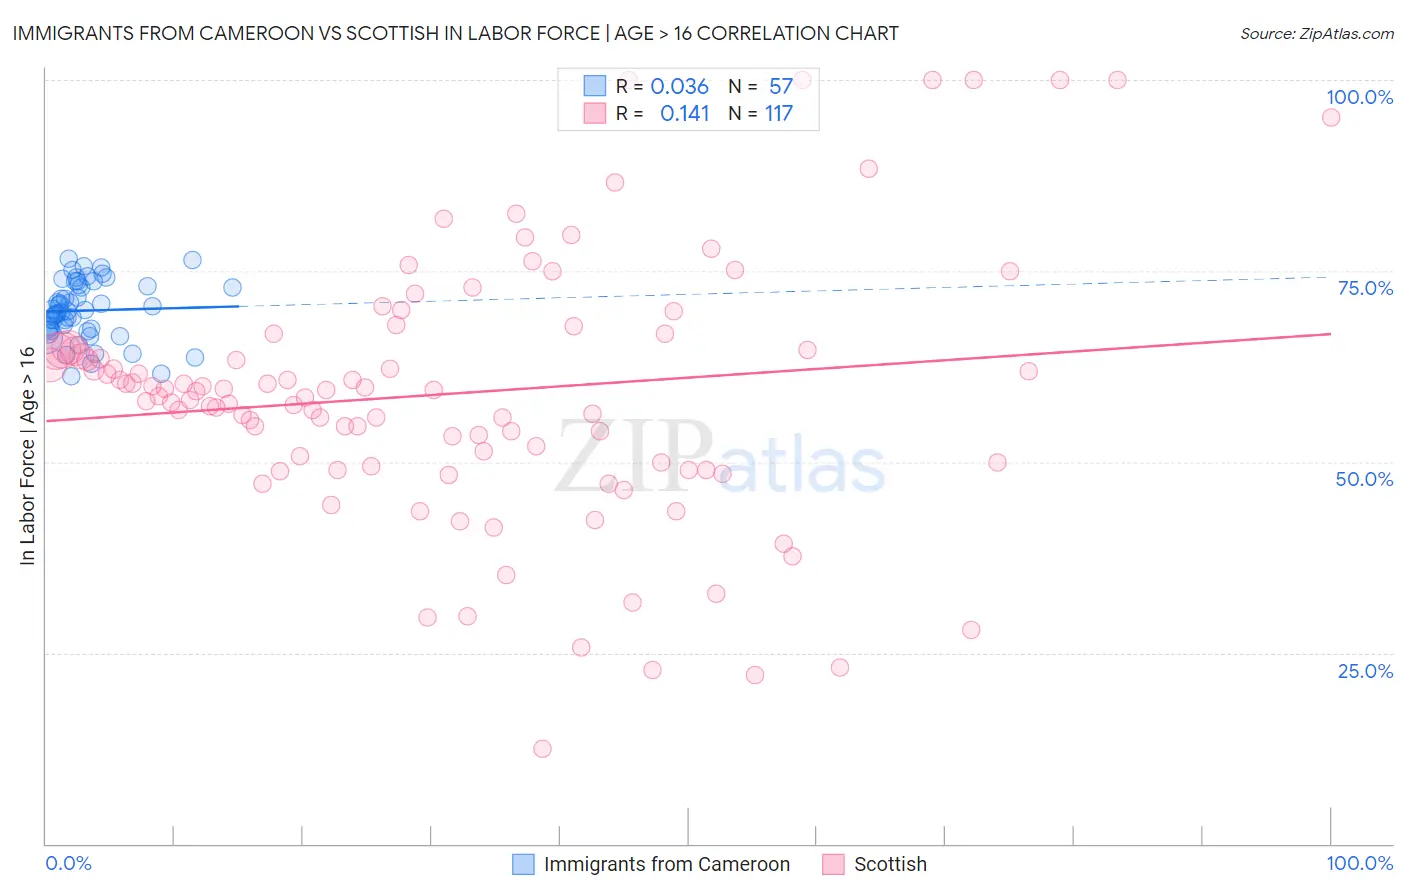
Immigrants from Cameroon vs Scottish In Labor Force | Age > 16 Correlation Chart
The statistical analysis conducted on geographies consisting of 130,760,472 people shows no correlation between the proportion of Immigrants from Cameroon and labor force participation rate among population ages 16 and over in the United States with a correlation coefficient (R) of 0.036 and weighted average of 68.7%. Similarly, the statistical analysis conducted on geographies consisting of 567,155,929 people shows a poor positive correlation between the proportion of Scottish and labor force participation rate among population ages 16 and over in the United States with a correlation coefficient (R) of 0.141 and weighted average of 63.9%, a difference of 7.5%.
In Labor Force | Age > 16 Correlation Summary
| Measurement | Immigrants from Cameroon | Scottish |
| Minimum | 61.3% | 12.5% |
| Maximum | 76.5% | 100.0% |
| Range | 15.3% | 87.5% |
| Mean | 69.8% | 58.9% |
| Median | 69.7% | 59.3% |
| Interquartile 25% (IQ1) | 67.3% | 49.7% |
| Interquartile 75% (IQ3) | 73.1% | 64.8% |
| Interquartile Range (IQR) | 5.7% | 15.1% |
| Standard Deviation (Sample) | 3.8% | 17.1% |
| Standard Deviation (Population) | 3.8% | 17.1% |
Similar Demographics by In Labor Force | Age > 16
Demographics Similar to Immigrants from Cameroon by In Labor Force | Age > 16
In terms of in labor force | age > 16, the demographic groups most similar to Immigrants from Cameroon are Immigrants from Eritrea (68.9%, a difference of 0.25%), Sierra Leonean (68.9%, a difference of 0.30%), Immigrants from Sierra Leone (68.5%, a difference of 0.32%), Immigrants from Eastern Africa (68.5%, a difference of 0.33%), and Immigrants from Bolivia (68.4%, a difference of 0.36%).
| Demographics | Rating | Rank | In Labor Force | Age > 16 |
| Immigrants | Ethiopia | 100.0 /100 | #1 | Exceptional 69.4% |
| Ethiopians | 100.0 /100 | #2 | Exceptional 69.3% |
| Somalis | 100.0 /100 | #3 | Exceptional 69.2% |
| Immigrants | Somalia | 100.0 /100 | #4 | Exceptional 69.1% |
| Sierra Leoneans | 100.0 /100 | #5 | Exceptional 68.9% |
| Immigrants | Eritrea | 100.0 /100 | #6 | Exceptional 68.9% |
| Immigrants | Cameroon | 100.0 /100 | #7 | Exceptional 68.7% |
| Immigrants | Sierra Leone | 100.0 /100 | #8 | Exceptional 68.5% |
| Immigrants | Eastern Africa | 100.0 /100 | #9 | Exceptional 68.5% |
| Immigrants | Bolivia | 100.0 /100 | #10 | Exceptional 68.4% |
| Bolivians | 100.0 /100 | #11 | Exceptional 68.2% |
| Sudanese | 100.0 /100 | #12 | Exceptional 68.0% |
| Immigrants | Nepal | 100.0 /100 | #13 | Exceptional 68.0% |
| Liberians | 100.0 /100 | #14 | Exceptional 67.8% |
| Immigrants | Middle Africa | 100.0 /100 | #15 | Exceptional 67.7% |
Demographics Similar to Scottish by In Labor Force | Age > 16
In terms of in labor force | age > 16, the demographic groups most similar to Scottish are Immigrants from Austria (63.9%, a difference of 0.0%), Slovak (63.9%, a difference of 0.030%), Spanish (63.9%, a difference of 0.050%), French (63.9%, a difference of 0.060%), and Immigrants from Germany (63.9%, a difference of 0.070%).
| Demographics | Rating | Rank | In Labor Force | Age > 16 |
| Immigrants | St. Vincent and the Grenadines | 0.2 /100 | #280 | Tragic 64.0% |
| French Canadians | 0.2 /100 | #281 | Tragic 64.0% |
| Immigrants | Guyana | 0.2 /100 | #282 | Tragic 64.0% |
| Immigrants | Germany | 0.1 /100 | #283 | Tragic 63.9% |
| French | 0.1 /100 | #284 | Tragic 63.9% |
| Slovaks | 0.1 /100 | #285 | Tragic 63.9% |
| Immigrants | Austria | 0.1 /100 | #286 | Tragic 63.9% |
| Scottish | 0.1 /100 | #287 | Tragic 63.9% |
| Spanish | 0.1 /100 | #288 | Tragic 63.9% |
| Celtics | 0.1 /100 | #289 | Tragic 63.8% |
| Hungarians | 0.1 /100 | #290 | Tragic 63.8% |
| Nepalese | 0.1 /100 | #291 | Tragic 63.8% |
| Spanish American Indians | 0.1 /100 | #292 | Tragic 63.8% |
| English | 0.1 /100 | #293 | Tragic 63.7% |
| Puget Sound Salish | 0.0 /100 | #294 | Tragic 63.7% |