Immigrants from Cambodia vs South American In Labor Force | Age 16-19
COMPARE
Immigrants from Cambodia
South American
In Labor Force | Age 16-19
In Labor Force | Age 16-19 Comparison
Immigrants from Cambodia
South Americans
36.7%
IN LABOR FORCE | AGE 16-19
58.4/ 100
METRIC RATING
171st/ 347
METRIC RANK
33.6%
IN LABOR FORCE | AGE 16-19
0.2/ 100
METRIC RATING
286th/ 347
METRIC RANK
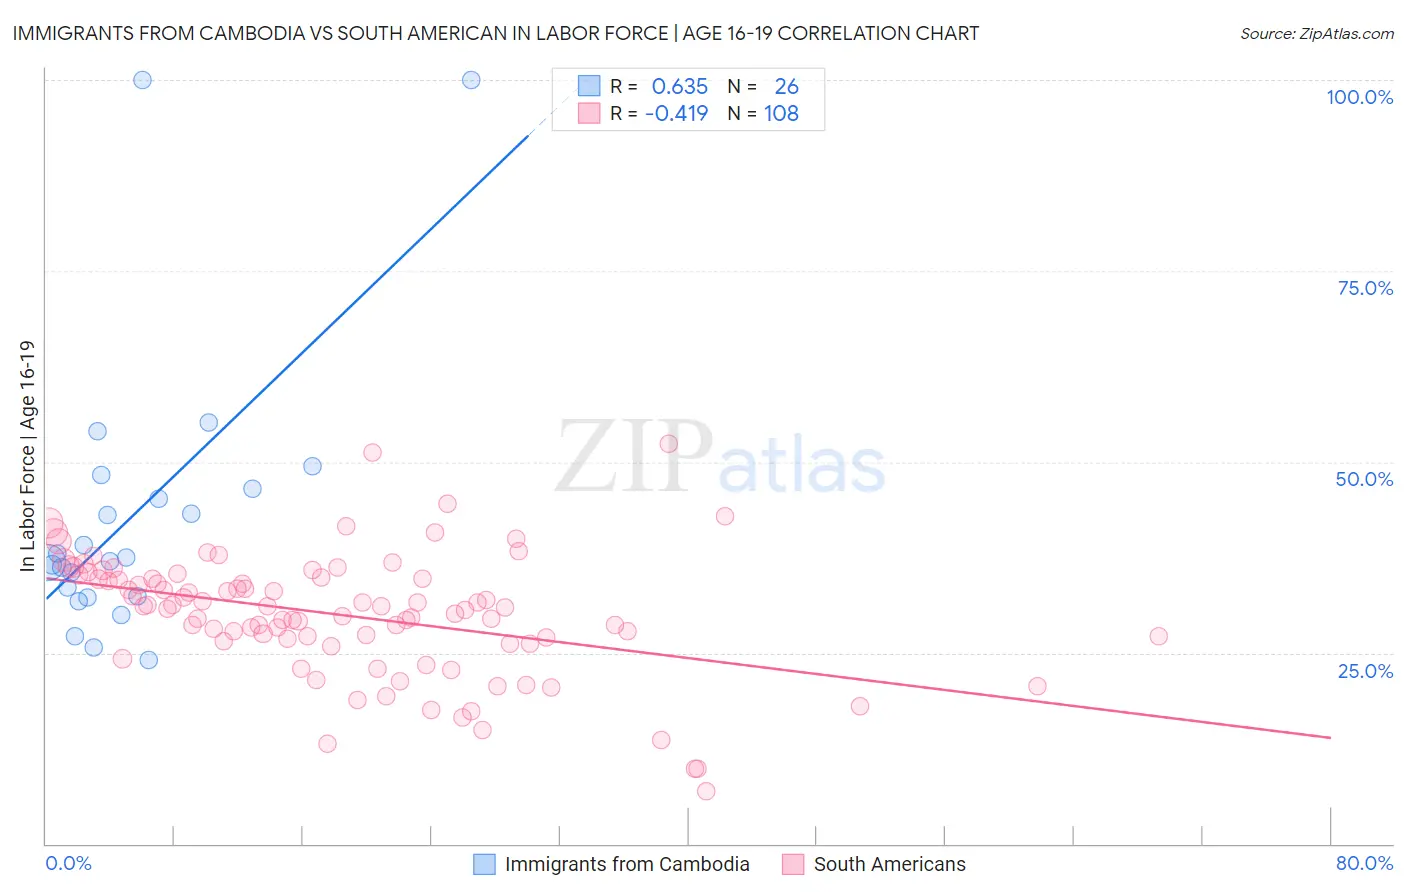
Immigrants from Cambodia vs South American In Labor Force | Age 16-19 Correlation Chart
The statistical analysis conducted on geographies consisting of 205,098,821 people shows a significant positive correlation between the proportion of Immigrants from Cambodia and labor force participation rate among population between the ages 16 and 19 in the United States with a correlation coefficient (R) of 0.635 and weighted average of 36.7%. Similarly, the statistical analysis conducted on geographies consisting of 492,865,168 people shows a moderate negative correlation between the proportion of South Americans and labor force participation rate among population between the ages 16 and 19 in the United States with a correlation coefficient (R) of -0.419 and weighted average of 33.6%, a difference of 9.3%.
In Labor Force | Age 16-19 Correlation Summary
| Measurement | Immigrants from Cambodia | South American |
| Minimum | 24.1% | 6.8% |
| Maximum | 100.0% | 52.4% |
| Range | 75.9% | 45.6% |
| Mean | 43.0% | 30.0% |
| Median | 37.2% | 31.0% |
| Interquartile 25% (IQ1) | 32.5% | 26.6% |
| Interquartile 75% (IQ3) | 46.4% | 34.8% |
| Interquartile Range (IQR) | 13.9% | 8.2% |
| Standard Deviation (Sample) | 18.6% | 8.0% |
| Standard Deviation (Population) | 18.3% | 8.0% |
Similar Demographics by In Labor Force | Age 16-19
Demographics Similar to Immigrants from Cambodia by In Labor Force | Age 16-19
In terms of in labor force | age 16-19, the demographic groups most similar to Immigrants from Cambodia are South African (36.7%, a difference of 0.010%), Russian (36.7%, a difference of 0.040%), Immigrants from South Africa (36.8%, a difference of 0.11%), Immigrants from Latvia (36.8%, a difference of 0.17%), and Palestinian (36.8%, a difference of 0.25%).
| Demographics | Rating | Rank | In Labor Force | Age 16-19 |
| Immigrants | Kuwait | 68.9 /100 | #164 | Good 36.9% |
| Yakama | 66.9 /100 | #165 | Good 36.9% |
| Immigrants | Western Africa | 66.7 /100 | #166 | Good 36.9% |
| Arabs | 63.6 /100 | #167 | Good 36.8% |
| Palestinians | 63.1 /100 | #168 | Good 36.8% |
| Immigrants | Latvia | 61.6 /100 | #169 | Good 36.8% |
| Immigrants | South Africa | 60.5 /100 | #170 | Good 36.8% |
| Immigrants | Cambodia | 58.4 /100 | #171 | Average 36.7% |
| South Africans | 58.3 /100 | #172 | Average 36.7% |
| Russians | 57.5 /100 | #173 | Average 36.7% |
| Immigrants | Czechoslovakia | 50.0 /100 | #174 | Average 36.6% |
| Natives/Alaskans | 49.0 /100 | #175 | Average 36.6% |
| Albanians | 48.8 /100 | #176 | Average 36.5% |
| Immigrants | Northern Europe | 46.6 /100 | #177 | Average 36.5% |
| Blacks/African Americans | 45.1 /100 | #178 | Average 36.5% |
Demographics Similar to South Americans by In Labor Force | Age 16-19
In terms of in labor force | age 16-19, the demographic groups most similar to South Americans are U.S. Virgin Islander (33.6%, a difference of 0.080%), Nepalese (33.5%, a difference of 0.23%), Immigrants from Spain (33.7%, a difference of 0.27%), Immigrants from Indonesia (33.5%, a difference of 0.27%), and Immigrants from Singapore (33.5%, a difference of 0.27%).
| Demographics | Rating | Rank | In Labor Force | Age 16-19 |
| Paraguayans | 0.3 /100 | #279 | Tragic 33.8% |
| Taiwanese | 0.3 /100 | #280 | Tragic 33.8% |
| Cypriots | 0.3 /100 | #281 | Tragic 33.8% |
| Immigrants | Korea | 0.3 /100 | #282 | Tragic 33.8% |
| Immigrants | Venezuela | 0.2 /100 | #283 | Tragic 33.7% |
| Immigrants | Spain | 0.2 /100 | #284 | Tragic 33.7% |
| U.S. Virgin Islanders | 0.2 /100 | #285 | Tragic 33.6% |
| South Americans | 0.2 /100 | #286 | Tragic 33.6% |
| Nepalese | 0.1 /100 | #287 | Tragic 33.5% |
| Immigrants | Indonesia | 0.1 /100 | #288 | Tragic 33.5% |
| Immigrants | Singapore | 0.1 /100 | #289 | Tragic 33.5% |
| Immigrants | Colombia | 0.1 /100 | #290 | Tragic 33.5% |
| Immigrants | Belarus | 0.1 /100 | #291 | Tragic 33.4% |
| Haitians | 0.1 /100 | #292 | Tragic 33.4% |
| Immigrants | South America | 0.1 /100 | #293 | Tragic 33.3% |