Immigrants from Cabo Verde vs Immigrants from Central America In Labor Force | Age 35-44
COMPARE
Immigrants from Cabo Verde
Immigrants from Central America
In Labor Force | Age 35-44
In Labor Force | Age 35-44 Comparison
Immigrants from Cabo Verde
Immigrants from Central America
86.2%
IN LABOR FORCE | AGE 35-44
100.0/ 100
METRIC RATING
4th/ 347
METRIC RANK
82.0%
IN LABOR FORCE | AGE 35-44
0.0/ 100
METRIC RATING
308th/ 347
METRIC RANK
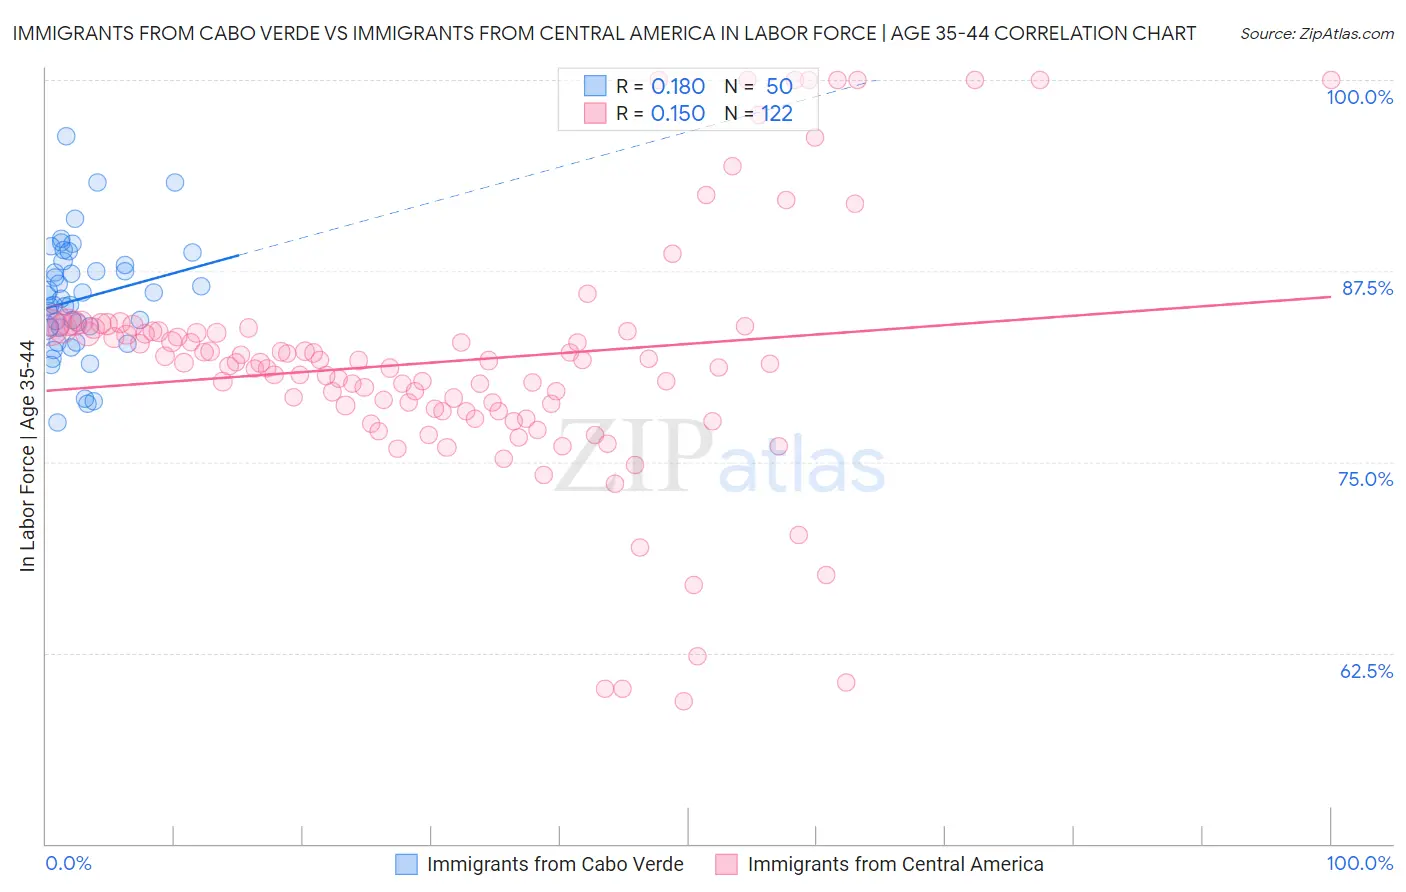
Immigrants from Cabo Verde vs Immigrants from Central America In Labor Force | Age 35-44 Correlation Chart
The statistical analysis conducted on geographies consisting of 38,133,227 people shows a poor positive correlation between the proportion of Immigrants from Cabo Verde and labor force participation rate among population between the ages 35 and 44 in the United States with a correlation coefficient (R) of 0.180 and weighted average of 86.2%. Similarly, the statistical analysis conducted on geographies consisting of 536,091,768 people shows a poor positive correlation between the proportion of Immigrants from Central America and labor force participation rate among population between the ages 35 and 44 in the United States with a correlation coefficient (R) of 0.150 and weighted average of 82.0%, a difference of 5.2%.
In Labor Force | Age 35-44 Correlation Summary
| Measurement | Immigrants from Cabo Verde | Immigrants from Central America |
| Minimum | 77.6% | 59.3% |
| Maximum | 96.3% | 100.0% |
| Range | 18.7% | 40.7% |
| Mean | 85.7% | 81.6% |
| Median | 85.5% | 81.5% |
| Interquartile 25% (IQ1) | 83.8% | 78.3% |
| Interquartile 75% (IQ3) | 87.9% | 83.5% |
| Interquartile Range (IQR) | 4.1% | 5.2% |
| Standard Deviation (Sample) | 3.8% | 8.0% |
| Standard Deviation (Population) | 3.7% | 8.0% |
Similar Demographics by In Labor Force | Age 35-44
Demographics Similar to Immigrants from Cabo Verde by In Labor Force | Age 35-44
In terms of in labor force | age 35-44, the demographic groups most similar to Immigrants from Cabo Verde are Immigrants from Bolivia (86.2%, a difference of 0.030%), Zimbabwean (86.1%, a difference of 0.13%), Bolivian (86.1%, a difference of 0.14%), Immigrants from Sierra Leone (86.1%, a difference of 0.18%), and Luxembourger (86.4%, a difference of 0.22%).
| Demographics | Rating | Rank | In Labor Force | Age 35-44 |
| Sierra Leoneans | 100.0 /100 | #1 | Exceptional 86.4% |
| Luxembourgers | 100.0 /100 | #2 | Exceptional 86.4% |
| Immigrants | Bolivia | 100.0 /100 | #3 | Exceptional 86.2% |
| Immigrants | Cabo Verde | 100.0 /100 | #4 | Exceptional 86.2% |
| Zimbabweans | 100.0 /100 | #5 | Exceptional 86.1% |
| Bolivians | 100.0 /100 | #6 | Exceptional 86.1% |
| Immigrants | Sierra Leone | 100.0 /100 | #7 | Exceptional 86.1% |
| Immigrants | Ethiopia | 100.0 /100 | #8 | Exceptional 85.9% |
| Ethiopians | 100.0 /100 | #9 | Exceptional 85.9% |
| Cape Verdeans | 100.0 /100 | #10 | Exceptional 85.8% |
| Immigrants | Cameroon | 100.0 /100 | #11 | Exceptional 85.8% |
| Liberians | 100.0 /100 | #12 | Exceptional 85.7% |
| Somalis | 100.0 /100 | #13 | Exceptional 85.6% |
| Immigrants | Somalia | 100.0 /100 | #14 | Exceptional 85.6% |
| Norwegians | 100.0 /100 | #15 | Exceptional 85.6% |
Demographics Similar to Immigrants from Central America by In Labor Force | Age 35-44
In terms of in labor force | age 35-44, the demographic groups most similar to Immigrants from Central America are Cree (82.0%, a difference of 0.0%), Blackfeet (81.9%, a difference of 0.13%), Hispanic or Latino (82.1%, a difference of 0.15%), Black/African American (82.2%, a difference of 0.25%), and Shoshone (82.2%, a difference of 0.27%).
| Demographics | Rating | Rank | In Labor Force | Age 35-44 |
| Spanish American Indians | 0.0 /100 | #301 | Tragic 82.5% |
| Americans | 0.0 /100 | #302 | Tragic 82.4% |
| Nepalese | 0.0 /100 | #303 | Tragic 82.4% |
| Marshallese | 0.0 /100 | #304 | Tragic 82.4% |
| Shoshone | 0.0 /100 | #305 | Tragic 82.2% |
| Blacks/African Americans | 0.0 /100 | #306 | Tragic 82.2% |
| Hispanics or Latinos | 0.0 /100 | #307 | Tragic 82.1% |
| Immigrants | Central America | 0.0 /100 | #308 | Tragic 82.0% |
| Cree | 0.0 /100 | #309 | Tragic 82.0% |
| Blackfeet | 0.0 /100 | #310 | Tragic 81.9% |
| Colville | 0.0 /100 | #311 | Tragic 81.7% |
| Alaska Natives | 0.0 /100 | #312 | Tragic 81.6% |
| Mexicans | 0.0 /100 | #313 | Tragic 81.6% |
| Cajuns | 0.0 /100 | #314 | Tragic 81.5% |
| Immigrants | Mexico | 0.0 /100 | #315 | Tragic 81.5% |