Immigrants from Cabo Verde vs Spanish In Labor Force | Age 35-44
COMPARE
Immigrants from Cabo Verde
Spanish
In Labor Force | Age 35-44
In Labor Force | Age 35-44 Comparison
Immigrants from Cabo Verde
Spanish
86.2%
IN LABOR FORCE | AGE 35-44
100.0/ 100
METRIC RATING
4th/ 347
METRIC RANK
83.2%
IN LABOR FORCE | AGE 35-44
0.0/ 100
METRIC RATING
273rd/ 347
METRIC RANK
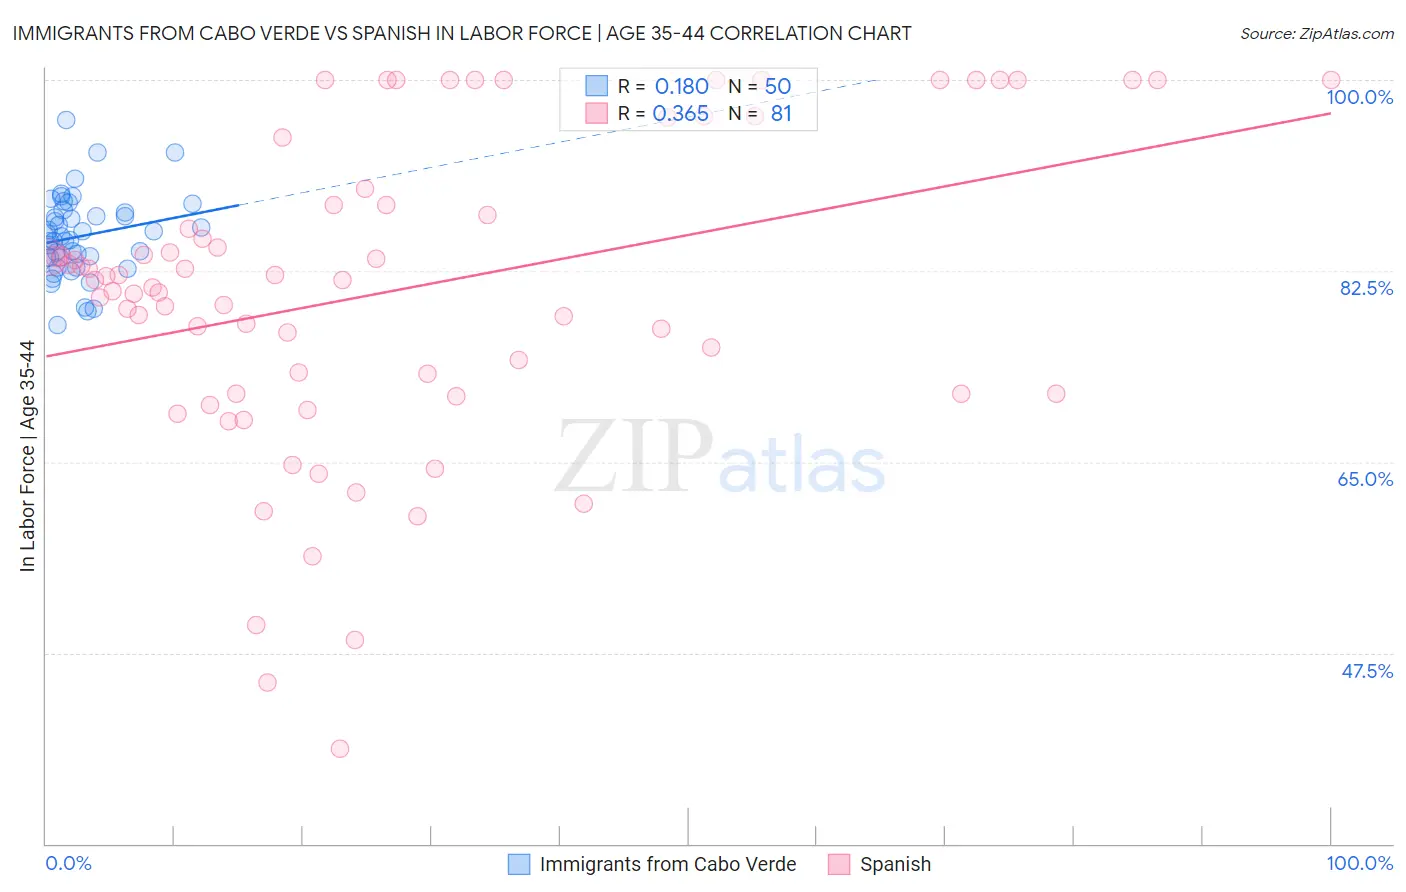
Immigrants from Cabo Verde vs Spanish In Labor Force | Age 35-44 Correlation Chart
The statistical analysis conducted on geographies consisting of 38,133,227 people shows a poor positive correlation between the proportion of Immigrants from Cabo Verde and labor force participation rate among population between the ages 35 and 44 in the United States with a correlation coefficient (R) of 0.180 and weighted average of 86.2%. Similarly, the statistical analysis conducted on geographies consisting of 421,966,219 people shows a mild positive correlation between the proportion of Spanish and labor force participation rate among population between the ages 35 and 44 in the United States with a correlation coefficient (R) of 0.365 and weighted average of 83.2%, a difference of 3.6%.
In Labor Force | Age 35-44 Correlation Summary
| Measurement | Immigrants from Cabo Verde | Spanish |
| Minimum | 77.6% | 38.7% |
| Maximum | 96.3% | 100.0% |
| Range | 18.7% | 61.3% |
| Mean | 85.7% | 80.7% |
| Median | 85.5% | 81.7% |
| Interquartile 25% (IQ1) | 83.8% | 71.3% |
| Interquartile 75% (IQ3) | 87.9% | 89.3% |
| Interquartile Range (IQR) | 4.1% | 18.0% |
| Standard Deviation (Sample) | 3.8% | 14.2% |
| Standard Deviation (Population) | 3.7% | 14.1% |
Similar Demographics by In Labor Force | Age 35-44
Demographics Similar to Immigrants from Cabo Verde by In Labor Force | Age 35-44
In terms of in labor force | age 35-44, the demographic groups most similar to Immigrants from Cabo Verde are Immigrants from Bolivia (86.2%, a difference of 0.030%), Zimbabwean (86.1%, a difference of 0.13%), Bolivian (86.1%, a difference of 0.14%), Immigrants from Sierra Leone (86.1%, a difference of 0.18%), and Luxembourger (86.4%, a difference of 0.22%).
| Demographics | Rating | Rank | In Labor Force | Age 35-44 |
| Sierra Leoneans | 100.0 /100 | #1 | Exceptional 86.4% |
| Luxembourgers | 100.0 /100 | #2 | Exceptional 86.4% |
| Immigrants | Bolivia | 100.0 /100 | #3 | Exceptional 86.2% |
| Immigrants | Cabo Verde | 100.0 /100 | #4 | Exceptional 86.2% |
| Zimbabweans | 100.0 /100 | #5 | Exceptional 86.1% |
| Bolivians | 100.0 /100 | #6 | Exceptional 86.1% |
| Immigrants | Sierra Leone | 100.0 /100 | #7 | Exceptional 86.1% |
| Immigrants | Ethiopia | 100.0 /100 | #8 | Exceptional 85.9% |
| Ethiopians | 100.0 /100 | #9 | Exceptional 85.9% |
| Cape Verdeans | 100.0 /100 | #10 | Exceptional 85.8% |
| Immigrants | Cameroon | 100.0 /100 | #11 | Exceptional 85.8% |
| Liberians | 100.0 /100 | #12 | Exceptional 85.7% |
| Somalis | 100.0 /100 | #13 | Exceptional 85.6% |
| Immigrants | Somalia | 100.0 /100 | #14 | Exceptional 85.6% |
| Norwegians | 100.0 /100 | #15 | Exceptional 85.6% |
Demographics Similar to Spanish by In Labor Force | Age 35-44
In terms of in labor force | age 35-44, the demographic groups most similar to Spanish are Immigrants from Fiji (83.2%, a difference of 0.0%), Immigrants from Honduras (83.3%, a difference of 0.020%), French American Indian (83.2%, a difference of 0.020%), Nonimmigrants (83.2%, a difference of 0.020%), and Hawaiian (83.2%, a difference of 0.030%).
| Demographics | Rating | Rank | In Labor Force | Age 35-44 |
| Spaniards | 0.1 /100 | #266 | Tragic 83.4% |
| Guamanians/Chamorros | 0.1 /100 | #267 | Tragic 83.4% |
| Hondurans | 0.1 /100 | #268 | Tragic 83.4% |
| Immigrants | Grenada | 0.1 /100 | #269 | Tragic 83.3% |
| Immigrants | Honduras | 0.0 /100 | #270 | Tragic 83.3% |
| French American Indians | 0.0 /100 | #271 | Tragic 83.2% |
| Immigrants | Fiji | 0.0 /100 | #272 | Tragic 83.2% |
| Spanish | 0.0 /100 | #273 | Tragic 83.2% |
| Immigrants | Nonimmigrants | 0.0 /100 | #274 | Tragic 83.2% |
| Hawaiians | 0.0 /100 | #275 | Tragic 83.2% |
| Delaware | 0.0 /100 | #276 | Tragic 83.2% |
| Samoans | 0.0 /100 | #277 | Tragic 83.2% |
| Belizeans | 0.0 /100 | #278 | Tragic 83.1% |
| Immigrants | Micronesia | 0.0 /100 | #279 | Tragic 83.1% |
| Dominicans | 0.0 /100 | #280 | Tragic 83.1% |