Immigrants from Hungary vs Alsatian In Labor Force | Age 30-34
COMPARE
Immigrants from Hungary
Alsatian
In Labor Force | Age 30-34
In Labor Force | Age 30-34 Comparison
Immigrants from Hungary
Alsatians
85.1%
IN LABOR FORCE | AGE 30-34
94.8/ 100
METRIC RATING
112th/ 347
METRIC RANK
85.2%
IN LABOR FORCE | AGE 30-34
96.3/ 100
METRIC RATING
105th/ 347
METRIC RANK
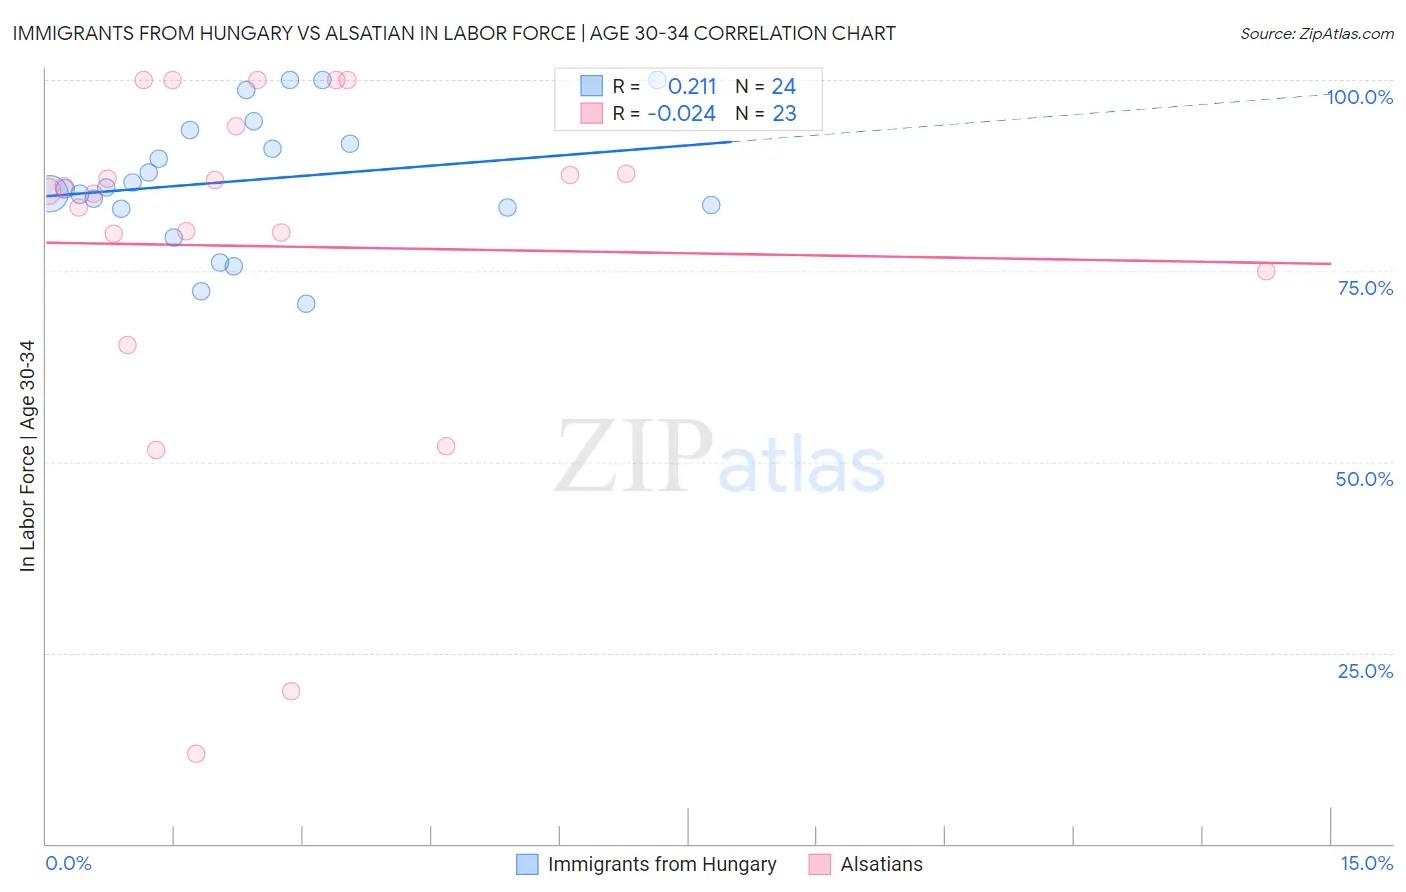
Immigrants from Hungary vs Alsatian In Labor Force | Age 30-34 Correlation Chart
The statistical analysis conducted on geographies consisting of 195,635,051 people shows a weak positive correlation between the proportion of Immigrants from Hungary and labor force participation rate among population between the ages 30 and 34 in the United States with a correlation coefficient (R) of 0.211 and weighted average of 85.1%. Similarly, the statistical analysis conducted on geographies consisting of 82,678,678 people shows no correlation between the proportion of Alsatians and labor force participation rate among population between the ages 30 and 34 in the United States with a correlation coefficient (R) of -0.024 and weighted average of 85.2%, a difference of 0.060%.
In Labor Force | Age 30-34 Correlation Summary
| Measurement | Immigrants from Hungary | Alsatian |
| Minimum | 70.7% | 11.8% |
| Maximum | 100.0% | 100.0% |
| Range | 29.3% | 88.2% |
| Mean | 86.8% | 78.2% |
| Median | 85.9% | 85.5% |
| Interquartile 25% (IQ1) | 83.2% | 75.0% |
| Interquartile 75% (IQ3) | 92.6% | 93.9% |
| Interquartile Range (IQR) | 9.3% | 18.9% |
| Standard Deviation (Sample) | 8.4% | 23.9% |
| Standard Deviation (Population) | 8.2% | 23.3% |
Demographics Similar to Immigrants from Hungary and Alsatians by In Labor Force | Age 30-34
In terms of in labor force | age 30-34, the demographic groups most similar to Immigrants from Hungary are Immigrants from Scotland (85.1%, a difference of 0.0%), Immigrants from Romania (85.1%, a difference of 0.0%), Yugoslavian (85.1%, a difference of 0.0%), Immigrants from South Central Asia (85.1%, a difference of 0.010%), and Egyptian (85.1%, a difference of 0.010%). Similarly, the demographic groups most similar to Alsatians are Immigrants from Middle Africa (85.2%, a difference of 0.0%), Immigrants from Northern Africa (85.2%, a difference of 0.0%), Ukrainian (85.2%, a difference of 0.010%), Immigrants from Ghana (85.2%, a difference of 0.010%), and Immigrants from Austria (85.2%, a difference of 0.020%).
| Demographics | Rating | Rank | In Labor Force | Age 30-34 |
| Immigrants | Uganda | 97.2 /100 | #98 | Exceptional 85.2% |
| Belgians | 97.2 /100 | #99 | Exceptional 85.2% |
| Sudanese | 97.1 /100 | #100 | Exceptional 85.2% |
| Immigrants | Belarus | 96.9 /100 | #101 | Exceptional 85.2% |
| Immigrants | Austria | 96.8 /100 | #102 | Exceptional 85.2% |
| Ukrainians | 96.6 /100 | #103 | Exceptional 85.2% |
| Immigrants | Ghana | 96.5 /100 | #104 | Exceptional 85.2% |
| Alsatians | 96.3 /100 | #105 | Exceptional 85.2% |
| Immigrants | Middle Africa | 96.3 /100 | #106 | Exceptional 85.2% |
| Immigrants | Northern Africa | 96.3 /100 | #107 | Exceptional 85.2% |
| Immigrants | Zimbabwe | 95.8 /100 | #108 | Exceptional 85.1% |
| Argentineans | 95.8 /100 | #109 | Exceptional 85.1% |
| Immigrants | South Africa | 95.3 /100 | #110 | Exceptional 85.1% |
| Immigrants | Scotland | 94.9 /100 | #111 | Exceptional 85.1% |
| Immigrants | Hungary | 94.8 /100 | #112 | Exceptional 85.1% |
| Immigrants | Romania | 94.7 /100 | #113 | Exceptional 85.1% |
| Yugoslavians | 94.7 /100 | #114 | Exceptional 85.1% |
| Immigrants | South Central Asia | 94.6 /100 | #115 | Exceptional 85.1% |
| Egyptians | 94.5 /100 | #116 | Exceptional 85.1% |
| Immigrants | Denmark | 94.3 /100 | #117 | Exceptional 85.1% |
| Immigrants | Malaysia | 94.2 /100 | #118 | Exceptional 85.1% |