Guyanese vs Alsatian In Labor Force | Age 30-34
COMPARE
Guyanese
Alsatian
In Labor Force | Age 30-34
In Labor Force | Age 30-34 Comparison
Guyanese
Alsatians
83.8%
IN LABOR FORCE | AGE 30-34
0.3/ 100
METRIC RATING
261st/ 347
METRIC RANK
85.2%
IN LABOR FORCE | AGE 30-34
96.3/ 100
METRIC RATING
105th/ 347
METRIC RANK
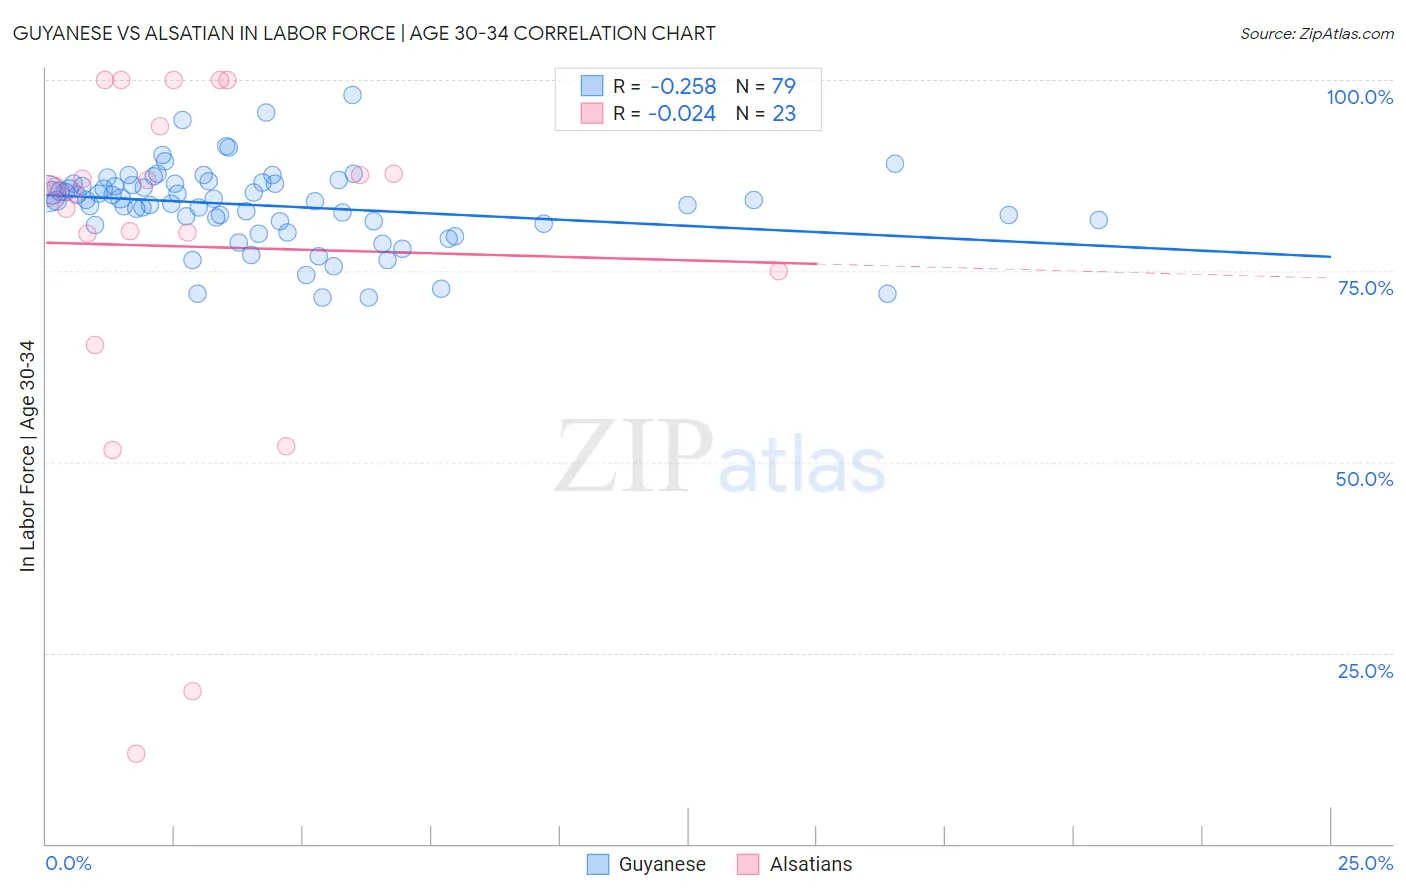
Guyanese vs Alsatian In Labor Force | Age 30-34 Correlation Chart
The statistical analysis conducted on geographies consisting of 176,819,802 people shows a weak negative correlation between the proportion of Guyanese and labor force participation rate among population between the ages 30 and 34 in the United States with a correlation coefficient (R) of -0.258 and weighted average of 83.8%. Similarly, the statistical analysis conducted on geographies consisting of 82,678,678 people shows no correlation between the proportion of Alsatians and labor force participation rate among population between the ages 30 and 34 in the United States with a correlation coefficient (R) of -0.024 and weighted average of 85.2%, a difference of 1.6%.
In Labor Force | Age 30-34 Correlation Summary
| Measurement | Guyanese | Alsatian |
| Minimum | 71.5% | 11.8% |
| Maximum | 98.1% | 100.0% |
| Range | 26.6% | 88.2% |
| Mean | 83.5% | 78.2% |
| Median | 84.3% | 85.5% |
| Interquartile 25% (IQ1) | 81.1% | 75.0% |
| Interquartile 75% (IQ3) | 86.4% | 93.9% |
| Interquartile Range (IQR) | 5.3% | 18.9% |
| Standard Deviation (Sample) | 5.2% | 23.9% |
| Standard Deviation (Population) | 5.2% | 23.3% |
Similar Demographics by In Labor Force | Age 30-34
Demographics Similar to Guyanese by In Labor Force | Age 30-34
In terms of in labor force | age 30-34, the demographic groups most similar to Guyanese are Immigrants from Dominican Republic (83.8%, a difference of 0.010%), Scotch-Irish (83.8%, a difference of 0.020%), Dominican (83.8%, a difference of 0.020%), Immigrants from Guyana (83.8%, a difference of 0.020%), and Honduran (83.8%, a difference of 0.030%).
| Demographics | Rating | Rank | In Labor Force | Age 30-34 |
| Immigrants | St. Vincent and the Grenadines | 0.5 /100 | #254 | Tragic 83.9% |
| Whites/Caucasians | 0.5 /100 | #255 | Tragic 83.9% |
| Immigrants | Lebanon | 0.4 /100 | #256 | Tragic 83.9% |
| Iraqis | 0.3 /100 | #257 | Tragic 83.8% |
| Hondurans | 0.3 /100 | #258 | Tragic 83.8% |
| Scotch-Irish | 0.3 /100 | #259 | Tragic 83.8% |
| Immigrants | Dominican Republic | 0.3 /100 | #260 | Tragic 83.8% |
| Guyanese | 0.3 /100 | #261 | Tragic 83.8% |
| Dominicans | 0.2 /100 | #262 | Tragic 83.8% |
| Immigrants | Guyana | 0.2 /100 | #263 | Tragic 83.8% |
| Guatemalans | 0.2 /100 | #264 | Tragic 83.7% |
| Immigrants | Honduras | 0.1 /100 | #265 | Tragic 83.7% |
| Immigrants | Guatemala | 0.1 /100 | #266 | Tragic 83.7% |
| Spaniards | 0.1 /100 | #267 | Tragic 83.6% |
| Immigrants | Bangladesh | 0.1 /100 | #268 | Tragic 83.6% |
Demographics Similar to Alsatians by In Labor Force | Age 30-34
In terms of in labor force | age 30-34, the demographic groups most similar to Alsatians are Immigrants from Middle Africa (85.2%, a difference of 0.0%), Immigrants from Northern Africa (85.2%, a difference of 0.0%), Ukrainian (85.2%, a difference of 0.010%), Immigrants from Ghana (85.2%, a difference of 0.010%), and Immigrants from Austria (85.2%, a difference of 0.020%).
| Demographics | Rating | Rank | In Labor Force | Age 30-34 |
| Immigrants | Uganda | 97.2 /100 | #98 | Exceptional 85.2% |
| Belgians | 97.2 /100 | #99 | Exceptional 85.2% |
| Sudanese | 97.1 /100 | #100 | Exceptional 85.2% |
| Immigrants | Belarus | 96.9 /100 | #101 | Exceptional 85.2% |
| Immigrants | Austria | 96.8 /100 | #102 | Exceptional 85.2% |
| Ukrainians | 96.6 /100 | #103 | Exceptional 85.2% |
| Immigrants | Ghana | 96.5 /100 | #104 | Exceptional 85.2% |
| Alsatians | 96.3 /100 | #105 | Exceptional 85.2% |
| Immigrants | Middle Africa | 96.3 /100 | #106 | Exceptional 85.2% |
| Immigrants | Northern Africa | 96.3 /100 | #107 | Exceptional 85.2% |
| Immigrants | Zimbabwe | 95.8 /100 | #108 | Exceptional 85.1% |
| Argentineans | 95.8 /100 | #109 | Exceptional 85.1% |
| Immigrants | South Africa | 95.3 /100 | #110 | Exceptional 85.1% |
| Immigrants | Scotland | 94.9 /100 | #111 | Exceptional 85.1% |
| Immigrants | Hungary | 94.8 /100 | #112 | Exceptional 85.1% |