Immigrants from Taiwan vs Alsatian In Labor Force | Age 30-34
COMPARE
Immigrants from Taiwan
Alsatian
In Labor Force | Age 30-34
In Labor Force | Age 30-34 Comparison
Immigrants from Taiwan
Alsatians
85.3%
IN LABOR FORCE | AGE 30-34
98.3/ 100
METRIC RATING
86th/ 347
METRIC RANK
85.2%
IN LABOR FORCE | AGE 30-34
96.3/ 100
METRIC RATING
105th/ 347
METRIC RANK
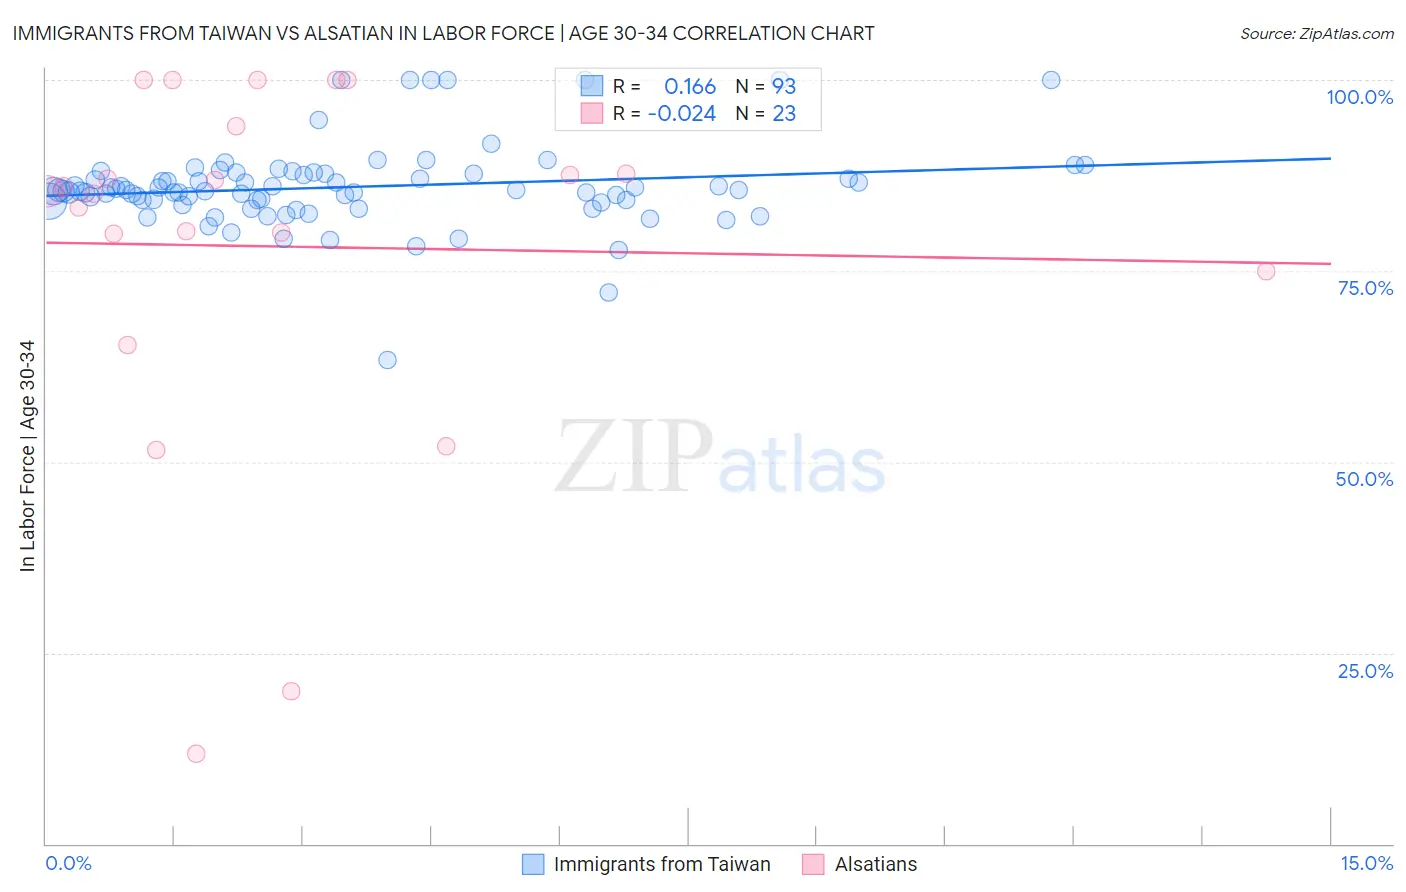
Immigrants from Taiwan vs Alsatian In Labor Force | Age 30-34 Correlation Chart
The statistical analysis conducted on geographies consisting of 298,154,729 people shows a poor positive correlation between the proportion of Immigrants from Taiwan and labor force participation rate among population between the ages 30 and 34 in the United States with a correlation coefficient (R) of 0.166 and weighted average of 85.3%. Similarly, the statistical analysis conducted on geographies consisting of 82,678,678 people shows no correlation between the proportion of Alsatians and labor force participation rate among population between the ages 30 and 34 in the United States with a correlation coefficient (R) of -0.024 and weighted average of 85.2%, a difference of 0.13%.
In Labor Force | Age 30-34 Correlation Summary
| Measurement | Immigrants from Taiwan | Alsatian |
| Minimum | 63.4% | 11.8% |
| Maximum | 100.0% | 100.0% |
| Range | 36.6% | 88.2% |
| Mean | 86.0% | 78.2% |
| Median | 85.5% | 85.5% |
| Interquartile 25% (IQ1) | 84.0% | 75.0% |
| Interquartile 75% (IQ3) | 87.7% | 93.9% |
| Interquartile Range (IQR) | 3.7% | 18.9% |
| Standard Deviation (Sample) | 5.5% | 23.9% |
| Standard Deviation (Population) | 5.5% | 23.3% |
Demographics Similar to Immigrants from Taiwan and Alsatians by In Labor Force | Age 30-34
In terms of in labor force | age 30-34, the demographic groups most similar to Immigrants from Taiwan are Immigrants from Northern Europe (85.3%, a difference of 0.0%), Immigrants from Belgium (85.3%, a difference of 0.010%), Mongolian (85.3%, a difference of 0.020%), Immigrants from Kazakhstan (85.3%, a difference of 0.020%), and Burmese (85.3%, a difference of 0.030%). Similarly, the demographic groups most similar to Alsatians are Ukrainian (85.2%, a difference of 0.010%), Immigrants from Ghana (85.2%, a difference of 0.010%), Immigrants from Austria (85.2%, a difference of 0.020%), Immigrants from Belarus (85.2%, a difference of 0.030%), and Sudanese (85.2%, a difference of 0.040%).
| Demographics | Rating | Rank | In Labor Force | Age 30-34 |
| Mongolians | 98.5 /100 | #85 | Exceptional 85.3% |
| Immigrants | Taiwan | 98.3 /100 | #86 | Exceptional 85.3% |
| Immigrants | Northern Europe | 98.2 /100 | #87 | Exceptional 85.3% |
| Immigrants | Belgium | 98.2 /100 | #88 | Exceptional 85.3% |
| Immigrants | Kazakhstan | 98.1 /100 | #89 | Exceptional 85.3% |
| Burmese | 97.9 /100 | #90 | Exceptional 85.3% |
| Immigrants | Moldova | 97.9 /100 | #91 | Exceptional 85.3% |
| German Russians | 97.7 /100 | #92 | Exceptional 85.2% |
| Immigrants | Norway | 97.6 /100 | #93 | Exceptional 85.2% |
| Swedes | 97.5 /100 | #94 | Exceptional 85.2% |
| Immigrants | India | 97.4 /100 | #95 | Exceptional 85.2% |
| Immigrants | Korea | 97.3 /100 | #96 | Exceptional 85.2% |
| Thais | 97.2 /100 | #97 | Exceptional 85.2% |
| Immigrants | Uganda | 97.2 /100 | #98 | Exceptional 85.2% |
| Belgians | 97.2 /100 | #99 | Exceptional 85.2% |
| Sudanese | 97.1 /100 | #100 | Exceptional 85.2% |
| Immigrants | Belarus | 96.9 /100 | #101 | Exceptional 85.2% |
| Immigrants | Austria | 96.8 /100 | #102 | Exceptional 85.2% |
| Ukrainians | 96.6 /100 | #103 | Exceptional 85.2% |
| Immigrants | Ghana | 96.5 /100 | #104 | Exceptional 85.2% |
| Alsatians | 96.3 /100 | #105 | Exceptional 85.2% |