Immigrants from Bulgaria vs Aleut Bachelor's Degree
COMPARE
Immigrants from Bulgaria
Aleut
Bachelor's Degree
Bachelor's Degree Comparison
Immigrants from Bulgaria
Aleuts
44.6%
BACHELOR'S DEGREE
99.9/ 100
METRIC RATING
46th/ 347
METRIC RANK
31.3%
BACHELOR'S DEGREE
0.1/ 100
METRIC RATING
285th/ 347
METRIC RANK
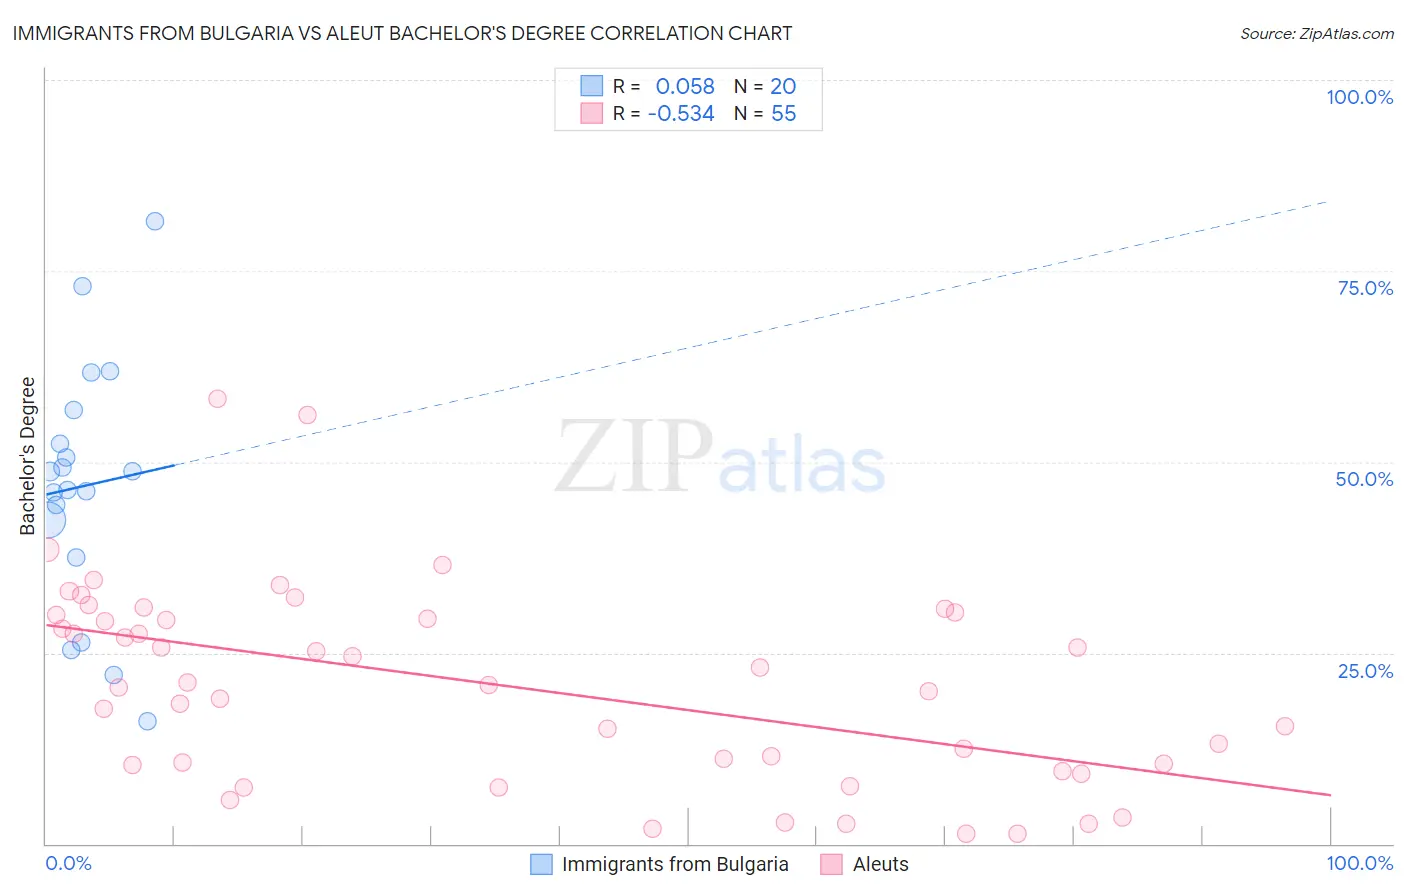
Immigrants from Bulgaria vs Aleut Bachelor's Degree Correlation Chart
The statistical analysis conducted on geographies consisting of 172,546,854 people shows a slight positive correlation between the proportion of Immigrants from Bulgaria and percentage of population with at least bachelor's degree education in the United States with a correlation coefficient (R) of 0.058 and weighted average of 44.6%. Similarly, the statistical analysis conducted on geographies consisting of 61,782,473 people shows a substantial negative correlation between the proportion of Aleuts and percentage of population with at least bachelor's degree education in the United States with a correlation coefficient (R) of -0.534 and weighted average of 31.3%, a difference of 42.3%.
Bachelor's Degree Correlation Summary
| Measurement | Immigrants from Bulgaria | Aleut |
| Minimum | 16.1% | 1.3% |
| Maximum | 81.6% | 58.3% |
| Range | 65.5% | 57.1% |
| Mean | 46.9% | 20.8% |
| Median | 47.6% | 20.9% |
| Interquartile 25% (IQ1) | 39.9% | 10.3% |
| Interquartile 75% (IQ3) | 54.5% | 29.9% |
| Interquartile Range (IQR) | 14.6% | 19.5% |
| Standard Deviation (Sample) | 16.3% | 13.0% |
| Standard Deviation (Population) | 15.9% | 12.9% |
Similar Demographics by Bachelor's Degree
Demographics Similar to Immigrants from Bulgaria by Bachelor's Degree
In terms of bachelor's degree, the demographic groups most similar to Immigrants from Bulgaria are Bolivian (44.6%, a difference of 0.040%), Estonian (44.6%, a difference of 0.040%), Immigrants from Kuwait (44.6%, a difference of 0.060%), Immigrants from Lithuania (44.6%, a difference of 0.080%), and Immigrants from Norway (44.5%, a difference of 0.16%).
| Demographics | Rating | Rank | Bachelor's Degree |
| Immigrants | Latvia | 100.0 /100 | #39 | Exceptional 45.1% |
| Immigrants | Belarus | 100.0 /100 | #40 | Exceptional 45.0% |
| Immigrants | Malaysia | 100.0 /100 | #41 | Exceptional 45.0% |
| Immigrants | Saudi Arabia | 100.0 /100 | #42 | Exceptional 44.8% |
| Immigrants | South Africa | 99.9 /100 | #43 | Exceptional 44.8% |
| Immigrants | Lithuania | 99.9 /100 | #44 | Exceptional 44.6% |
| Immigrants | Kuwait | 99.9 /100 | #45 | Exceptional 44.6% |
| Immigrants | Bulgaria | 99.9 /100 | #46 | Exceptional 44.6% |
| Bolivians | 99.9 /100 | #47 | Exceptional 44.6% |
| Estonians | 99.9 /100 | #48 | Exceptional 44.6% |
| Immigrants | Norway | 99.9 /100 | #49 | Exceptional 44.5% |
| Immigrants | Greece | 99.9 /100 | #50 | Exceptional 44.5% |
| Asians | 99.9 /100 | #51 | Exceptional 44.4% |
| Immigrants | Spain | 99.9 /100 | #52 | Exceptional 44.3% |
| Immigrants | Asia | 99.9 /100 | #53 | Exceptional 44.3% |
Demographics Similar to Aleuts by Bachelor's Degree
In terms of bachelor's degree, the demographic groups most similar to Aleuts are Haitian (31.3%, a difference of 0.010%), Honduran (31.3%, a difference of 0.040%), Immigrants from El Salvador (31.3%, a difference of 0.050%), Immigrants from Caribbean (31.4%, a difference of 0.32%), and Blackfeet (31.5%, a difference of 0.47%).
| Demographics | Rating | Rank | Bachelor's Degree |
| Marshallese | 0.1 /100 | #278 | Tragic 31.7% |
| Hawaiians | 0.1 /100 | #279 | Tragic 31.6% |
| Immigrants | Laos | 0.1 /100 | #280 | Tragic 31.6% |
| Blackfeet | 0.1 /100 | #281 | Tragic 31.5% |
| Immigrants | Caribbean | 0.1 /100 | #282 | Tragic 31.4% |
| Hondurans | 0.1 /100 | #283 | Tragic 31.3% |
| Haitians | 0.1 /100 | #284 | Tragic 31.3% |
| Aleuts | 0.1 /100 | #285 | Tragic 31.3% |
| Immigrants | El Salvador | 0.1 /100 | #286 | Tragic 31.3% |
| Ottawa | 0.1 /100 | #287 | Tragic 31.1% |
| Guatemalans | 0.1 /100 | #288 | Tragic 31.0% |
| Puerto Ricans | 0.1 /100 | #289 | Tragic 31.0% |
| Immigrants | Honduras | 0.1 /100 | #290 | Tragic 30.9% |
| Blacks/African Americans | 0.1 /100 | #291 | Tragic 30.9% |
| Ute | 0.1 /100 | #292 | Tragic 30.9% |