Immigrants from Brazil vs Yaqui In Labor Force | Age 16-19
COMPARE
Immigrants from Brazil
Yaqui
In Labor Force | Age 16-19
In Labor Force | Age 16-19 Comparison
Immigrants from Brazil
Yaqui
37.1%
IN LABOR FORCE | AGE 16-19
76.5/ 100
METRIC RATING
157th/ 347
METRIC RANK
37.1%
IN LABOR FORCE | AGE 16-19
74.4/ 100
METRIC RATING
159th/ 347
METRIC RANK
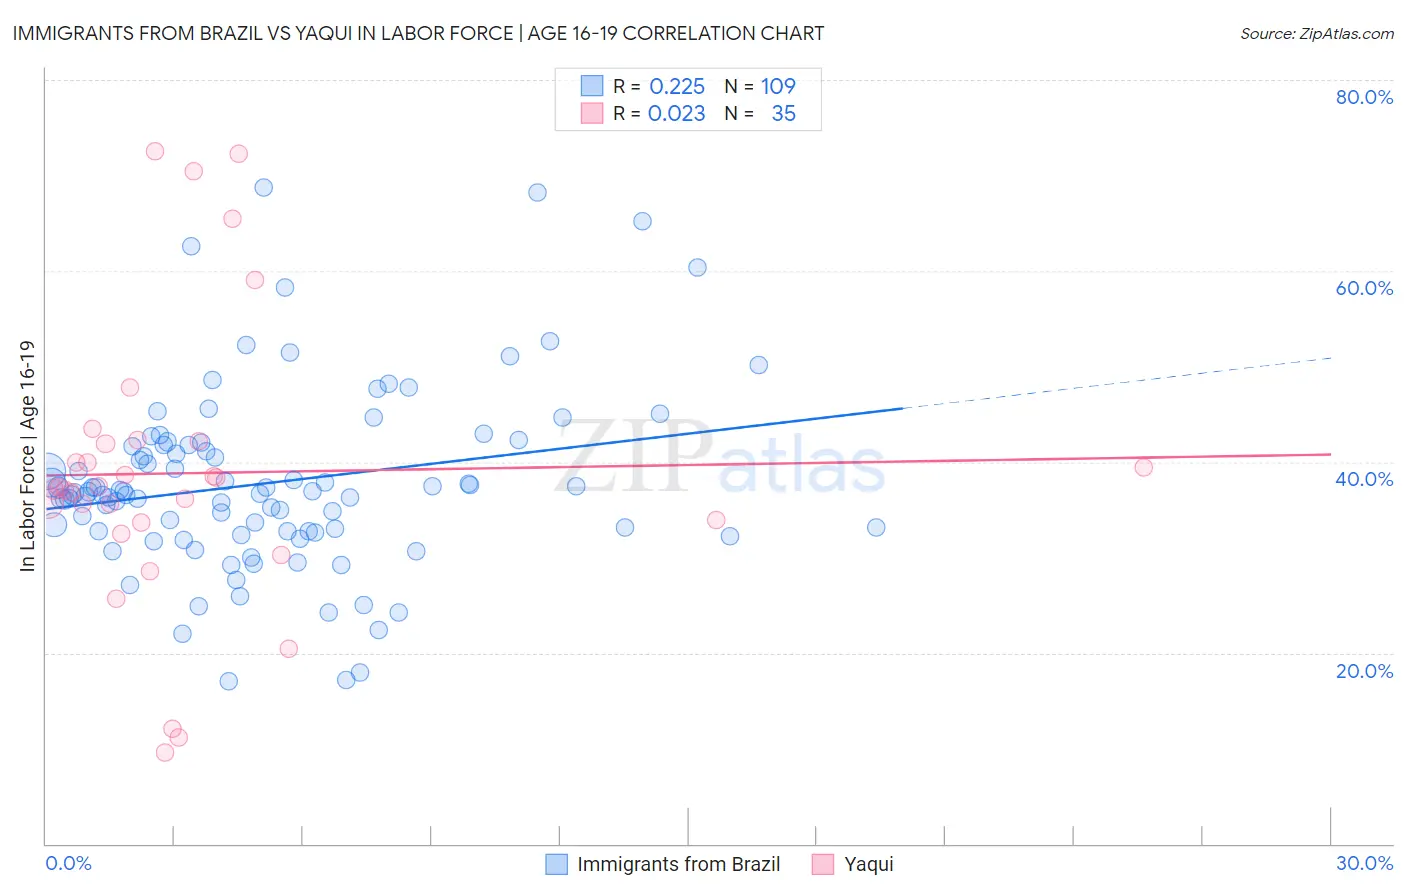
Immigrants from Brazil vs Yaqui In Labor Force | Age 16-19 Correlation Chart
The statistical analysis conducted on geographies consisting of 342,618,647 people shows a weak positive correlation between the proportion of Immigrants from Brazil and labor force participation rate among population between the ages 16 and 19 in the United States with a correlation coefficient (R) of 0.225 and weighted average of 37.1%. Similarly, the statistical analysis conducted on geographies consisting of 107,656,749 people shows no correlation between the proportion of Yaqui and labor force participation rate among population between the ages 16 and 19 in the United States with a correlation coefficient (R) of 0.023 and weighted average of 37.1%, a difference of 0.14%.
In Labor Force | Age 16-19 Correlation Summary
| Measurement | Immigrants from Brazil | Yaqui |
| Minimum | 17.1% | 9.5% |
| Maximum | 68.8% | 72.6% |
| Range | 51.7% | 63.1% |
| Mean | 37.8% | 38.8% |
| Median | 36.7% | 37.3% |
| Interquartile 25% (IQ1) | 32.7% | 33.7% |
| Interquartile 75% (IQ3) | 41.8% | 42.1% |
| Interquartile Range (IQR) | 9.1% | 8.4% |
| Standard Deviation (Sample) | 9.5% | 15.0% |
| Standard Deviation (Population) | 9.5% | 14.8% |
Demographics Similar to Immigrants from Brazil and Yaqui by In Labor Force | Age 16-19
In terms of in labor force | age 16-19, the demographic groups most similar to Immigrants from Brazil are Ute (37.1%, a difference of 0.050%), Immigrants from Saudi Arabia (37.0%, a difference of 0.17%), Kiowa (37.2%, a difference of 0.29%), Immigrants from Lithuania (37.2%, a difference of 0.31%), and Cambodian (37.0%, a difference of 0.32%). Similarly, the demographic groups most similar to Yaqui are Immigrants from Saudi Arabia (37.0%, a difference of 0.030%), Ute (37.1%, a difference of 0.080%), Cambodian (37.0%, a difference of 0.18%), Immigrants from Jordan (36.9%, a difference of 0.31%), and Bermudan (36.9%, a difference of 0.32%).
| Demographics | Rating | Rank | In Labor Force | Age 16-19 |
| Romanians | 87.3 /100 | #148 | Excellent 37.5% |
| Native Hawaiians | 85.0 /100 | #149 | Excellent 37.4% |
| Tsimshian | 84.7 /100 | #150 | Excellent 37.4% |
| Immigrants | Poland | 84.4 /100 | #151 | Excellent 37.3% |
| Immigrants | Sierra Leone | 83.6 /100 | #152 | Excellent 37.3% |
| Arapaho | 81.8 /100 | #153 | Excellent 37.3% |
| Immigrants | Bulgaria | 81.6 /100 | #154 | Excellent 37.3% |
| Immigrants | Lithuania | 80.7 /100 | #155 | Excellent 37.2% |
| Kiowa | 80.4 /100 | #156 | Excellent 37.2% |
| Immigrants | Brazil | 76.5 /100 | #157 | Good 37.1% |
| Ute | 75.7 /100 | #158 | Good 37.1% |
| Yaqui | 74.4 /100 | #159 | Good 37.1% |
| Immigrants | Saudi Arabia | 73.9 /100 | #160 | Good 37.0% |
| Cambodians | 71.5 /100 | #161 | Good 37.0% |
| Immigrants | Jordan | 69.5 /100 | #162 | Good 36.9% |
| Bermudans | 69.3 /100 | #163 | Good 36.9% |
| Immigrants | Kuwait | 68.9 /100 | #164 | Good 36.9% |
| Yakama | 66.9 /100 | #165 | Good 36.9% |
| Immigrants | Western Africa | 66.7 /100 | #166 | Good 36.9% |
| Arabs | 63.6 /100 | #167 | Good 36.8% |
| Palestinians | 63.1 /100 | #168 | Good 36.8% |