Immigrants from Brazil vs Greek Ambulatory Disability
COMPARE
Immigrants from Brazil
Greek
Ambulatory Disability
Ambulatory Disability Comparison
Immigrants from Brazil
Greeks
5.6%
AMBULATORY DISABILITY
99.8/ 100
METRIC RATING
57th/ 347
METRIC RANK
6.0%
AMBULATORY DISABILITY
79.6/ 100
METRIC RATING
151st/ 347
METRIC RANK
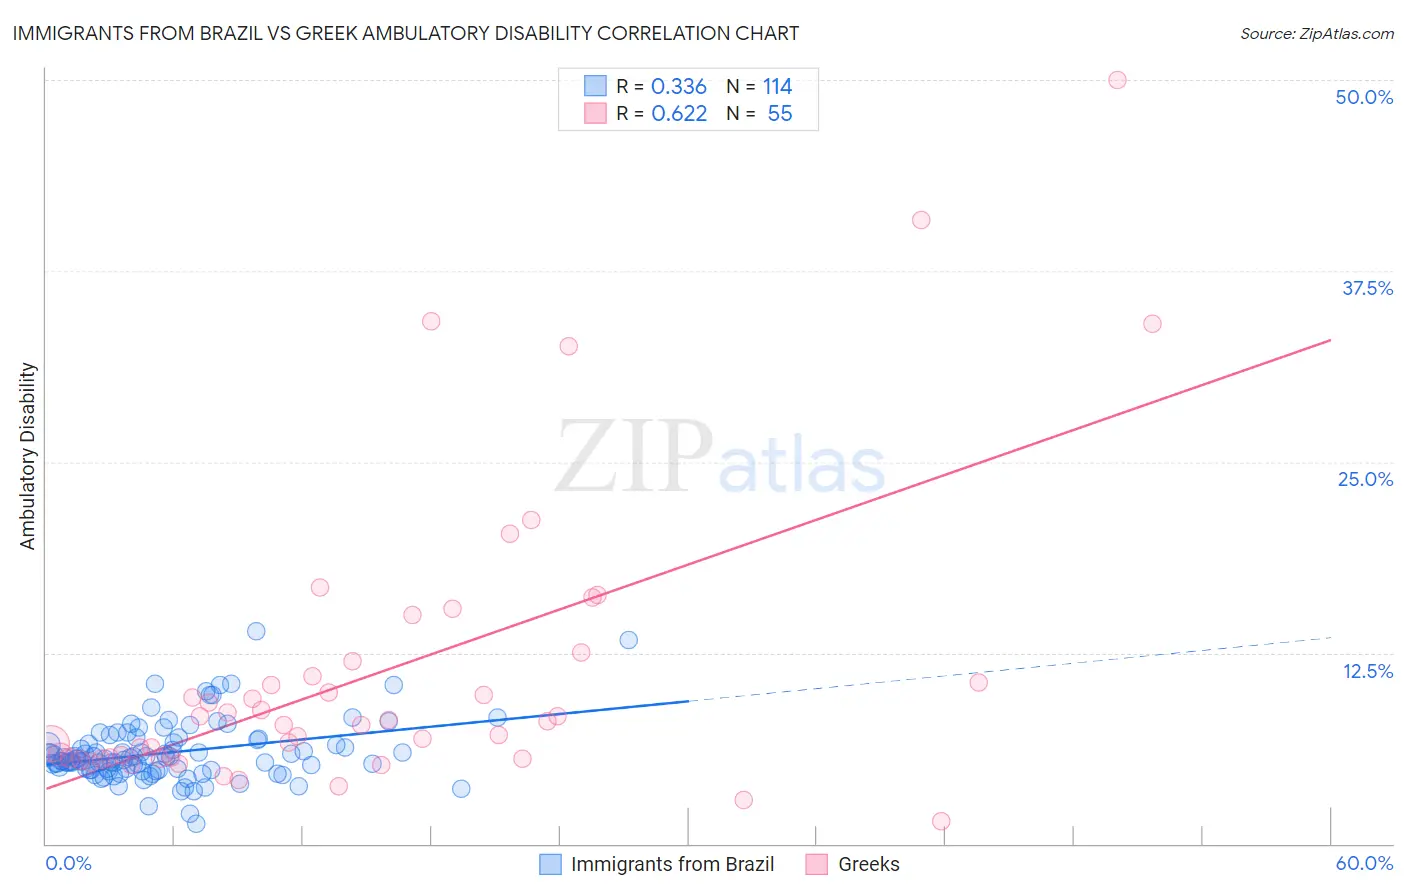
Immigrants from Brazil vs Greek Ambulatory Disability Correlation Chart
The statistical analysis conducted on geographies consisting of 342,966,003 people shows a mild positive correlation between the proportion of Immigrants from Brazil and percentage of population with ambulatory disability in the United States with a correlation coefficient (R) of 0.336 and weighted average of 5.6%. Similarly, the statistical analysis conducted on geographies consisting of 482,531,888 people shows a significant positive correlation between the proportion of Greeks and percentage of population with ambulatory disability in the United States with a correlation coefficient (R) of 0.622 and weighted average of 6.0%, a difference of 6.8%.
Ambulatory Disability Correlation Summary
| Measurement | Immigrants from Brazil | Greek |
| Minimum | 1.3% | 1.5% |
| Maximum | 13.9% | 50.0% |
| Range | 12.6% | 48.5% |
| Mean | 6.0% | 11.2% |
| Median | 5.6% | 8.0% |
| Interquartile 25% (IQ1) | 4.8% | 5.6% |
| Interquartile 75% (IQ3) | 6.6% | 11.9% |
| Interquartile Range (IQR) | 1.8% | 6.3% |
| Standard Deviation (Sample) | 2.0% | 9.8% |
| Standard Deviation (Population) | 2.0% | 9.7% |
Similar Demographics by Ambulatory Disability
Demographics Similar to Immigrants from Brazil by Ambulatory Disability
In terms of ambulatory disability, the demographic groups most similar to Immigrants from Brazil are Immigrants from Zimbabwe (5.6%, a difference of 0.060%), Immigrants from Afghanistan (5.6%, a difference of 0.10%), Immigrants from Lithuania (5.6%, a difference of 0.14%), Inupiat (5.6%, a difference of 0.24%), and Immigrants from Belgium (5.6%, a difference of 0.26%).
| Demographics | Rating | Rank | Ambulatory Disability |
| Luxembourgers | 99.9 /100 | #50 | Exceptional 5.6% |
| Taiwanese | 99.8 /100 | #51 | Exceptional 5.6% |
| Jordanians | 99.8 /100 | #52 | Exceptional 5.6% |
| Immigrants | Egypt | 99.8 /100 | #53 | Exceptional 5.6% |
| Immigrants | Eastern Africa | 99.8 /100 | #54 | Exceptional 5.6% |
| Immigrants | Bulgaria | 99.8 /100 | #55 | Exceptional 5.6% |
| Inupiat | 99.8 /100 | #56 | Exceptional 5.6% |
| Immigrants | Brazil | 99.8 /100 | #57 | Exceptional 5.6% |
| Immigrants | Zimbabwe | 99.8 /100 | #58 | Exceptional 5.6% |
| Immigrants | Afghanistan | 99.8 /100 | #59 | Exceptional 5.6% |
| Immigrants | Lithuania | 99.8 /100 | #60 | Exceptional 5.6% |
| Immigrants | Belgium | 99.7 /100 | #61 | Exceptional 5.6% |
| Immigrants | Spain | 99.7 /100 | #62 | Exceptional 5.6% |
| Immigrants | France | 99.7 /100 | #63 | Exceptional 5.6% |
| Laotians | 99.7 /100 | #64 | Exceptional 5.7% |
Demographics Similar to Greeks by Ambulatory Disability
In terms of ambulatory disability, the demographic groups most similar to Greeks are Immigrants from Austria (6.0%, a difference of 0.070%), Maltese (6.0%, a difference of 0.18%), Lithuanian (6.0%, a difference of 0.20%), Immigrants from Eastern Europe (6.0%, a difference of 0.21%), and Immigrants from Moldova (6.0%, a difference of 0.25%).
| Demographics | Rating | Rank | Ambulatory Disability |
| Macedonians | 82.8 /100 | #144 | Excellent 6.0% |
| Pakistanis | 82.5 /100 | #145 | Excellent 6.0% |
| Immigrants | Greece | 82.5 /100 | #146 | Excellent 6.0% |
| Immigrants | Moldova | 82.4 /100 | #147 | Excellent 6.0% |
| Immigrants | Eastern Europe | 82.0 /100 | #148 | Excellent 6.0% |
| Lithuanians | 81.9 /100 | #149 | Excellent 6.0% |
| Maltese | 81.6 /100 | #150 | Excellent 6.0% |
| Greeks | 79.6 /100 | #151 | Good 6.0% |
| Immigrants | Austria | 78.8 /100 | #152 | Good 6.0% |
| Syrians | 75.5 /100 | #153 | Good 6.0% |
| Immigrants | Croatia | 75.1 /100 | #154 | Good 6.0% |
| Immigrants | Scotland | 72.1 /100 | #155 | Good 6.0% |
| Northern Europeans | 71.8 /100 | #156 | Good 6.0% |
| Ghanaians | 71.3 /100 | #157 | Good 6.0% |
| Immigrants | Fiji | 71.2 /100 | #158 | Good 6.0% |