Immigrants from Iran vs Tsimshian In Labor Force | Age 20-64
COMPARE
Immigrants from Iran
Tsimshian
In Labor Force | Age 20-64
In Labor Force | Age 20-64 Comparison
Immigrants from Iran
Tsimshian
79.9%
IN LABOR FORCE | AGE 20-64
88.3/ 100
METRIC RATING
131st/ 347
METRIC RANK
78.7%
IN LABOR FORCE | AGE 20-64
0.4/ 100
METRIC RATING
259th/ 347
METRIC RANK
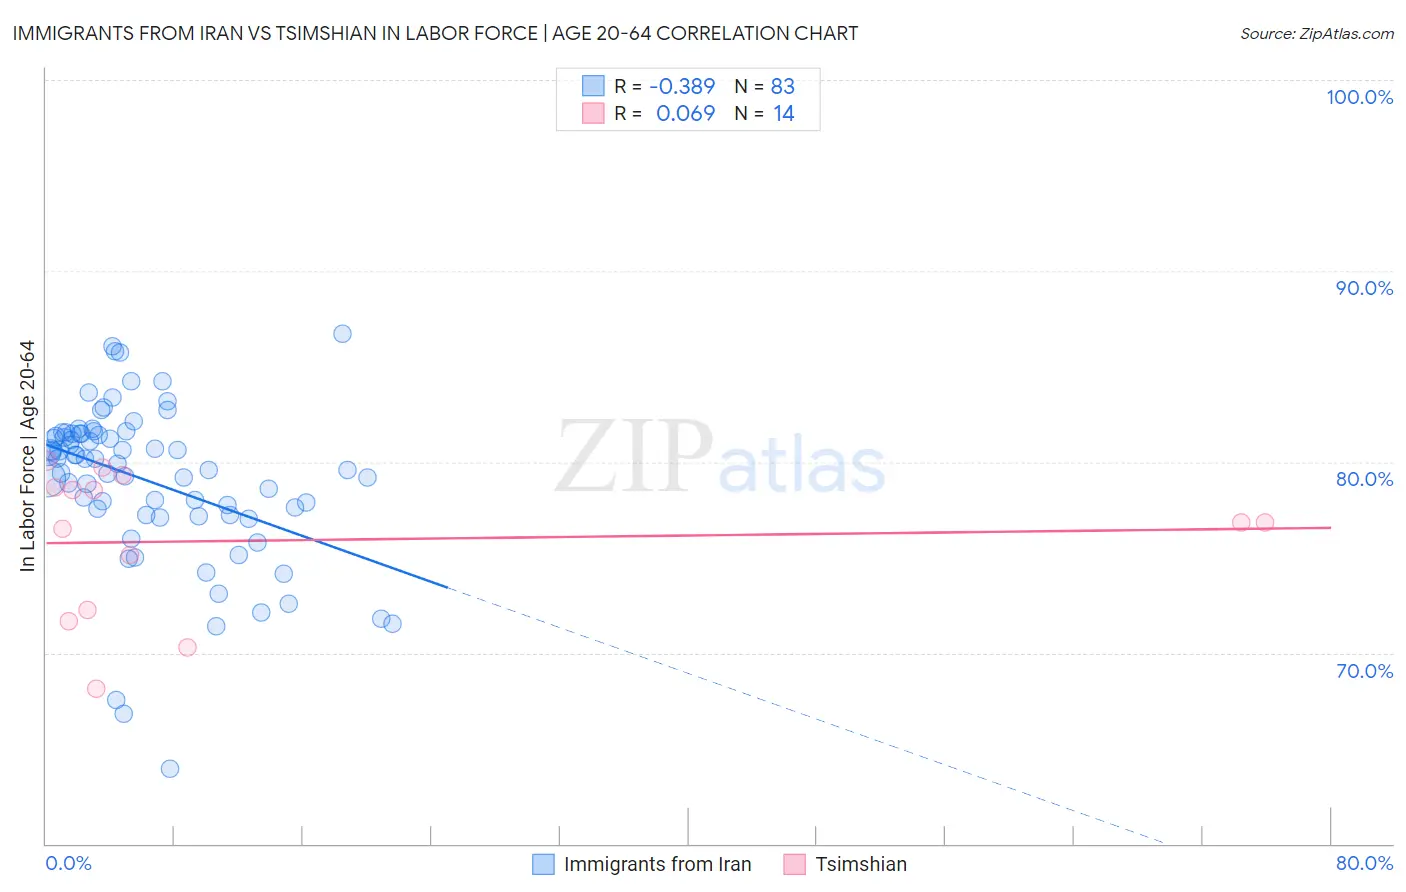
Immigrants from Iran vs Tsimshian In Labor Force | Age 20-64 Correlation Chart
The statistical analysis conducted on geographies consisting of 279,901,668 people shows a mild negative correlation between the proportion of Immigrants from Iran and labor force participation rate among population between the ages 20 and 64 in the United States with a correlation coefficient (R) of -0.389 and weighted average of 79.9%. Similarly, the statistical analysis conducted on geographies consisting of 15,626,183 people shows a slight positive correlation between the proportion of Tsimshian and labor force participation rate among population between the ages 20 and 64 in the United States with a correlation coefficient (R) of 0.069 and weighted average of 78.7%, a difference of 1.5%.
In Labor Force | Age 20-64 Correlation Summary
| Measurement | Immigrants from Iran | Tsimshian |
| Minimum | 63.9% | 68.1% |
| Maximum | 86.7% | 80.1% |
| Range | 22.8% | 12.0% |
| Mean | 79.0% | 75.9% |
| Median | 80.1% | 76.8% |
| Interquartile 25% (IQ1) | 77.3% | 72.3% |
| Interquartile 75% (IQ3) | 81.5% | 78.7% |
| Interquartile Range (IQR) | 4.2% | 6.4% |
| Standard Deviation (Sample) | 4.2% | 3.8% |
| Standard Deviation (Population) | 4.2% | 3.7% |
Similar Demographics by In Labor Force | Age 20-64
Demographics Similar to Immigrants from Iran by In Labor Force | Age 20-64
In terms of in labor force | age 20-64, the demographic groups most similar to Immigrants from Iran are Italian (79.9%, a difference of 0.010%), Immigrants from Zaire (79.9%, a difference of 0.010%), Indian (Asian) (79.9%, a difference of 0.010%), South American Indian (79.9%, a difference of 0.010%), and Immigrants from Eastern Asia (79.9%, a difference of 0.020%).
| Demographics | Rating | Rank | In Labor Force | Age 20-64 |
| Immigrants | Europe | 91.6 /100 | #124 | Exceptional 79.9% |
| Danes | 91.5 /100 | #125 | Exceptional 79.9% |
| Immigrants | France | 90.7 /100 | #126 | Exceptional 79.9% |
| Immigrants | Czechoslovakia | 89.7 /100 | #127 | Excellent 79.9% |
| Immigrants | Eastern Asia | 89.4 /100 | #128 | Excellent 79.9% |
| Italians | 88.9 /100 | #129 | Excellent 79.9% |
| Immigrants | Zaire | 88.6 /100 | #130 | Excellent 79.9% |
| Immigrants | Iran | 88.3 /100 | #131 | Excellent 79.9% |
| Indians (Asian) | 87.7 /100 | #132 | Excellent 79.9% |
| South American Indians | 87.6 /100 | #133 | Excellent 79.9% |
| Belgians | 87.4 /100 | #134 | Excellent 79.9% |
| Ukrainians | 86.8 /100 | #135 | Excellent 79.9% |
| Immigrants | Singapore | 86.7 /100 | #136 | Excellent 79.9% |
| Immigrants | Ukraine | 86.5 /100 | #137 | Excellent 79.9% |
| Immigrants | Nigeria | 86.4 /100 | #138 | Excellent 79.9% |
Demographics Similar to Tsimshian by In Labor Force | Age 20-64
In terms of in labor force | age 20-64, the demographic groups most similar to Tsimshian are Immigrants from Guatemala (78.7%, a difference of 0.030%), Guatemalan (78.7%, a difference of 0.040%), Hawaiian (78.7%, a difference of 0.050%), Celtic (78.7%, a difference of 0.050%), and Immigrants from Lebanon (78.7%, a difference of 0.070%).
| Demographics | Rating | Rank | In Labor Force | Age 20-64 |
| Immigrants | Honduras | 0.6 /100 | #252 | Tragic 78.7% |
| Basques | 0.5 /100 | #253 | Tragic 78.7% |
| Immigrants | Lebanon | 0.5 /100 | #254 | Tragic 78.7% |
| Hawaiians | 0.5 /100 | #255 | Tragic 78.7% |
| Celtics | 0.5 /100 | #256 | Tragic 78.7% |
| Guatemalans | 0.4 /100 | #257 | Tragic 78.7% |
| Immigrants | Guatemala | 0.4 /100 | #258 | Tragic 78.7% |
| Tsimshian | 0.4 /100 | #259 | Tragic 78.7% |
| Immigrants | Fiji | 0.3 /100 | #260 | Tragic 78.6% |
| Whites/Caucasians | 0.2 /100 | #261 | Tragic 78.5% |
| Fijians | 0.1 /100 | #262 | Tragic 78.4% |
| Pennsylvania Germans | 0.1 /100 | #263 | Tragic 78.4% |
| Spaniards | 0.1 /100 | #264 | Tragic 78.4% |
| British West Indians | 0.1 /100 | #265 | Tragic 78.4% |
| Bahamians | 0.1 /100 | #266 | Tragic 78.4% |