Immigrants from Belize vs Immigrants from Hungary In Labor Force | Age 20-64
COMPARE
Immigrants from Belize
Immigrants from Hungary
In Labor Force | Age 20-64
In Labor Force | Age 20-64 Comparison
Immigrants from Belize
Immigrants from Hungary
78.0%
IN LABOR FORCE | AGE 20-64
0.0/ 100
METRIC RATING
286th/ 347
METRIC RANK
79.5%
IN LABOR FORCE | AGE 20-64
36.8/ 100
METRIC RATING
183rd/ 347
METRIC RANK
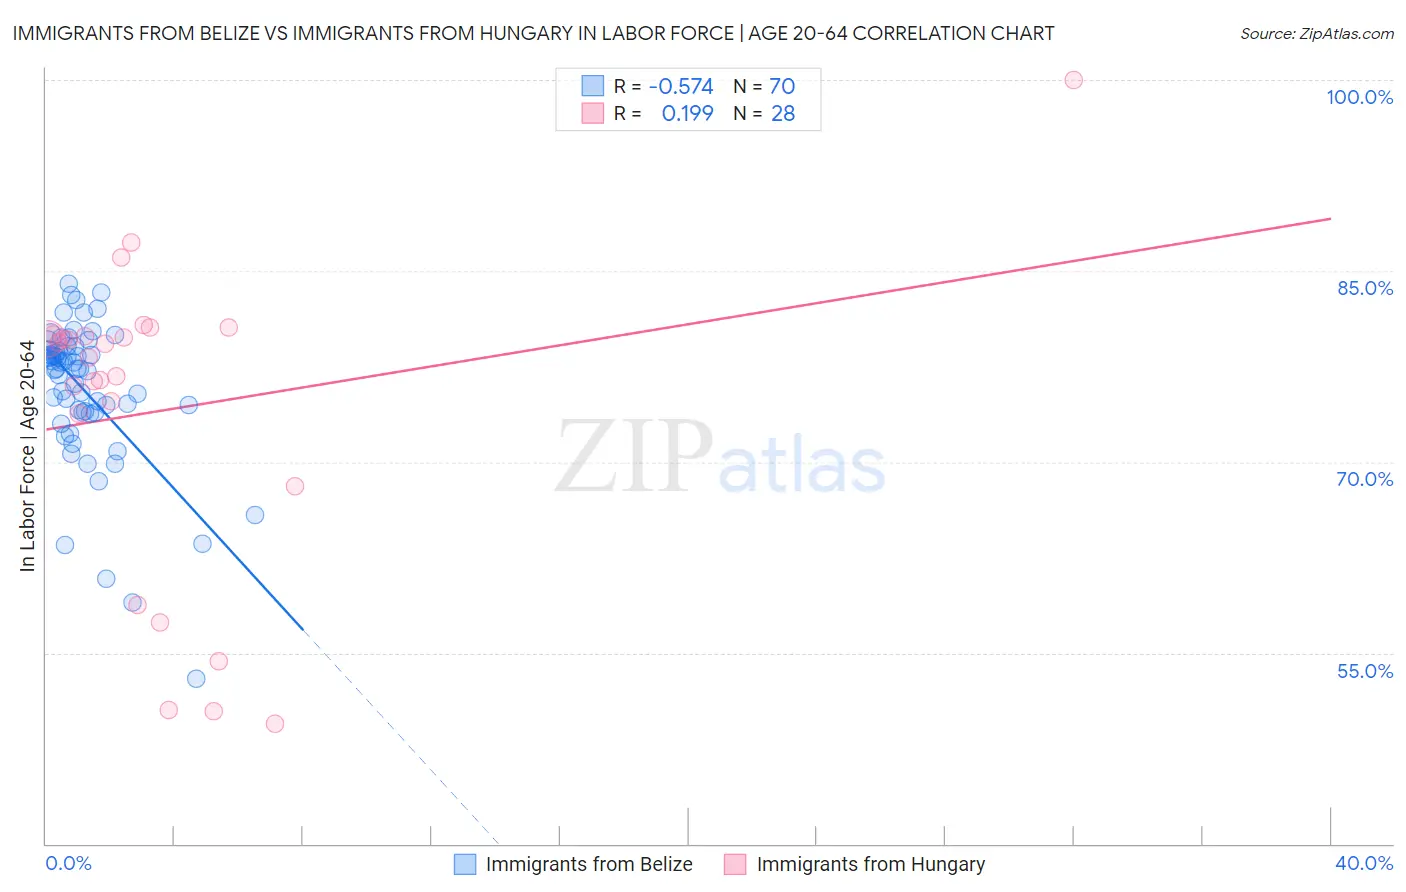
Immigrants from Belize vs Immigrants from Hungary In Labor Force | Age 20-64 Correlation Chart
The statistical analysis conducted on geographies consisting of 130,318,427 people shows a substantial negative correlation between the proportion of Immigrants from Belize and labor force participation rate among population between the ages 20 and 64 in the United States with a correlation coefficient (R) of -0.574 and weighted average of 78.0%. Similarly, the statistical analysis conducted on geographies consisting of 195,708,395 people shows a poor positive correlation between the proportion of Immigrants from Hungary and labor force participation rate among population between the ages 20 and 64 in the United States with a correlation coefficient (R) of 0.199 and weighted average of 79.5%, a difference of 1.9%.
In Labor Force | Age 20-64 Correlation Summary
| Measurement | Immigrants from Belize | Immigrants from Hungary |
| Minimum | 53.0% | 49.4% |
| Maximum | 84.0% | 100.0% |
| Range | 31.0% | 50.6% |
| Mean | 75.6% | 74.1% |
| Median | 77.3% | 78.7% |
| Interquartile 25% (IQ1) | 73.9% | 70.9% |
| Interquartile 75% (IQ3) | 78.8% | 79.9% |
| Interquartile Range (IQR) | 4.9% | 9.0% |
| Standard Deviation (Sample) | 5.8% | 12.3% |
| Standard Deviation (Population) | 5.7% | 12.1% |
Similar Demographics by In Labor Force | Age 20-64
Demographics Similar to Immigrants from Belize by In Labor Force | Age 20-64
In terms of in labor force | age 20-64, the demographic groups most similar to Immigrants from Belize are Vietnamese (78.0%, a difference of 0.0%), Osage (78.0%, a difference of 0.010%), Hmong (77.9%, a difference of 0.080%), African (77.9%, a difference of 0.090%), and Immigrants from Bangladesh (77.9%, a difference of 0.10%).
| Demographics | Rating | Rank | In Labor Force | Age 20-64 |
| Belizeans | 0.0 /100 | #279 | Tragic 78.2% |
| Immigrants | Dominica | 0.0 /100 | #280 | Tragic 78.1% |
| Guyanese | 0.0 /100 | #281 | Tragic 78.1% |
| Immigrants | St. Vincent and the Grenadines | 0.0 /100 | #282 | Tragic 78.1% |
| Immigrants | Nonimmigrants | 0.0 /100 | #283 | Tragic 78.1% |
| Immigrants | Guyana | 0.0 /100 | #284 | Tragic 78.1% |
| Osage | 0.0 /100 | #285 | Tragic 78.0% |
| Immigrants | Belize | 0.0 /100 | #286 | Tragic 78.0% |
| Vietnamese | 0.0 /100 | #287 | Tragic 78.0% |
| Hmong | 0.0 /100 | #288 | Tragic 77.9% |
| Africans | 0.0 /100 | #289 | Tragic 77.9% |
| Immigrants | Bangladesh | 0.0 /100 | #290 | Tragic 77.9% |
| Spanish Americans | 0.0 /100 | #291 | Tragic 77.8% |
| Immigrants | Azores | 0.0 /100 | #292 | Tragic 77.8% |
| Delaware | 0.0 /100 | #293 | Tragic 77.8% |
Demographics Similar to Immigrants from Hungary by In Labor Force | Age 20-64
In terms of in labor force | age 20-64, the demographic groups most similar to Immigrants from Hungary are Malaysian (79.5%, a difference of 0.0%), Immigrants from Saudi Arabia (79.5%, a difference of 0.010%), Finnish (79.5%, a difference of 0.010%), Israeli (79.5%, a difference of 0.020%), and Northern European (79.5%, a difference of 0.020%).
| Demographics | Rating | Rank | In Labor Force | Age 20-64 |
| Australians | 46.0 /100 | #176 | Average 79.5% |
| Immigrants | Netherlands | 45.2 /100 | #177 | Average 79.5% |
| Czechoslovakians | 44.3 /100 | #178 | Average 79.5% |
| Armenians | 41.4 /100 | #179 | Average 79.5% |
| Salvadorans | 41.0 /100 | #180 | Average 79.5% |
| Immigrants | Saudi Arabia | 37.7 /100 | #181 | Fair 79.5% |
| Malaysians | 37.1 /100 | #182 | Fair 79.5% |
| Immigrants | Hungary | 36.8 /100 | #183 | Fair 79.5% |
| Finns | 35.9 /100 | #184 | Fair 79.5% |
| Israelis | 34.7 /100 | #185 | Fair 79.5% |
| Northern Europeans | 34.5 /100 | #186 | Fair 79.5% |
| Assyrians/Chaldeans/Syriacs | 33.3 /100 | #187 | Fair 79.4% |
| Immigrants | Haiti | 32.1 /100 | #188 | Fair 79.4% |
| Immigrants | El Salvador | 30.9 /100 | #189 | Fair 79.4% |
| Immigrants | Syria | 30.8 /100 | #190 | Fair 79.4% |