Immigrants from Belize vs Arapaho In Labor Force | Age 20-64
COMPARE
Immigrants from Belize
Arapaho
In Labor Force | Age 20-64
In Labor Force | Age 20-64 Comparison
Immigrants from Belize
Arapaho
78.0%
IN LABOR FORCE | AGE 20-64
0.0/ 100
METRIC RATING
286th/ 347
METRIC RANK
74.4%
IN LABOR FORCE | AGE 20-64
0.0/ 100
METRIC RATING
332nd/ 347
METRIC RANK
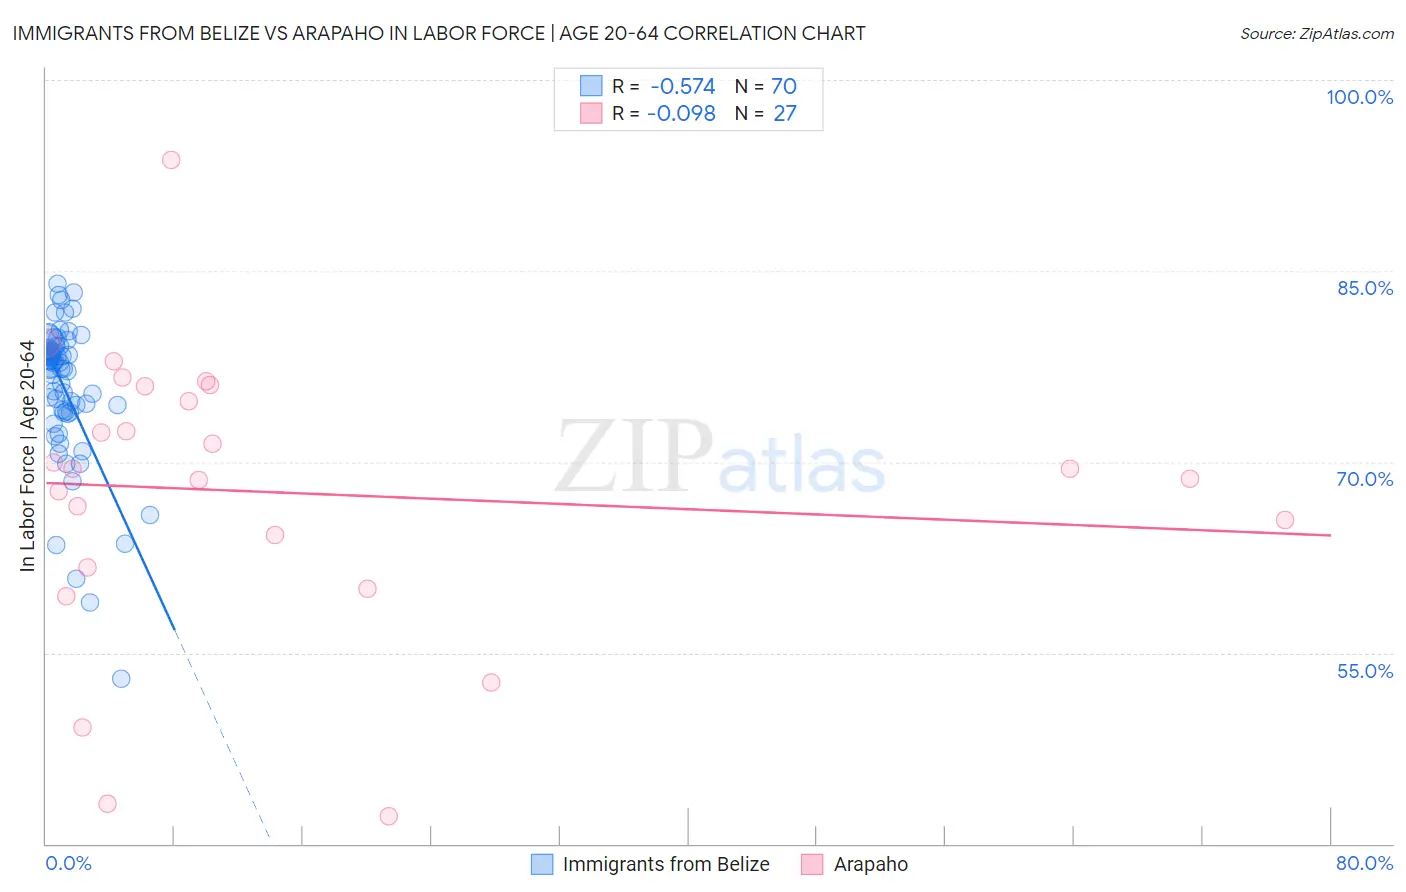
Immigrants from Belize vs Arapaho In Labor Force | Age 20-64 Correlation Chart
The statistical analysis conducted on geographies consisting of 130,318,427 people shows a substantial negative correlation between the proportion of Immigrants from Belize and labor force participation rate among population between the ages 20 and 64 in the United States with a correlation coefficient (R) of -0.574 and weighted average of 78.0%. Similarly, the statistical analysis conducted on geographies consisting of 29,780,325 people shows a slight negative correlation between the proportion of Arapaho and labor force participation rate among population between the ages 20 and 64 in the United States with a correlation coefficient (R) of -0.098 and weighted average of 74.4%, a difference of 4.8%.
In Labor Force | Age 20-64 Correlation Summary
| Measurement | Immigrants from Belize | Arapaho |
| Minimum | 53.0% | 42.2% |
| Maximum | 84.0% | 93.7% |
| Range | 31.0% | 51.5% |
| Mean | 75.6% | 67.6% |
| Median | 77.3% | 69.5% |
| Interquartile 25% (IQ1) | 73.9% | 61.7% |
| Interquartile 75% (IQ3) | 78.8% | 75.9% |
| Interquartile Range (IQR) | 4.9% | 14.2% |
| Standard Deviation (Sample) | 5.8% | 11.3% |
| Standard Deviation (Population) | 5.7% | 11.1% |
Similar Demographics by In Labor Force | Age 20-64
Demographics Similar to Immigrants from Belize by In Labor Force | Age 20-64
In terms of in labor force | age 20-64, the demographic groups most similar to Immigrants from Belize are Vietnamese (78.0%, a difference of 0.0%), Osage (78.0%, a difference of 0.010%), Hmong (77.9%, a difference of 0.080%), African (77.9%, a difference of 0.090%), and Immigrants from Bangladesh (77.9%, a difference of 0.10%).
| Demographics | Rating | Rank | In Labor Force | Age 20-64 |
| Belizeans | 0.0 /100 | #279 | Tragic 78.2% |
| Immigrants | Dominica | 0.0 /100 | #280 | Tragic 78.1% |
| Guyanese | 0.0 /100 | #281 | Tragic 78.1% |
| Immigrants | St. Vincent and the Grenadines | 0.0 /100 | #282 | Tragic 78.1% |
| Immigrants | Nonimmigrants | 0.0 /100 | #283 | Tragic 78.1% |
| Immigrants | Guyana | 0.0 /100 | #284 | Tragic 78.1% |
| Osage | 0.0 /100 | #285 | Tragic 78.0% |
| Immigrants | Belize | 0.0 /100 | #286 | Tragic 78.0% |
| Vietnamese | 0.0 /100 | #287 | Tragic 78.0% |
| Hmong | 0.0 /100 | #288 | Tragic 77.9% |
| Africans | 0.0 /100 | #289 | Tragic 77.9% |
| Immigrants | Bangladesh | 0.0 /100 | #290 | Tragic 77.9% |
| Spanish Americans | 0.0 /100 | #291 | Tragic 77.8% |
| Immigrants | Azores | 0.0 /100 | #292 | Tragic 77.8% |
| Delaware | 0.0 /100 | #293 | Tragic 77.8% |
Demographics Similar to Arapaho by In Labor Force | Age 20-64
In terms of in labor force | age 20-64, the demographic groups most similar to Arapaho are Paiute (74.7%, a difference of 0.40%), Colville (74.8%, a difference of 0.54%), Cheyenne (74.8%, a difference of 0.60%), Native/Alaskan (73.9%, a difference of 0.66%), and Kiowa (75.0%, a difference of 0.80%).
| Demographics | Rating | Rank | In Labor Force | Age 20-64 |
| Menominee | 0.0 /100 | #325 | Tragic 75.3% |
| Creek | 0.0 /100 | #326 | Tragic 75.1% |
| Sioux | 0.0 /100 | #327 | Tragic 75.0% |
| Kiowa | 0.0 /100 | #328 | Tragic 75.0% |
| Cheyenne | 0.0 /100 | #329 | Tragic 74.8% |
| Colville | 0.0 /100 | #330 | Tragic 74.8% |
| Paiute | 0.0 /100 | #331 | Tragic 74.7% |
| Arapaho | 0.0 /100 | #332 | Tragic 74.4% |
| Natives/Alaskans | 0.0 /100 | #333 | Tragic 73.9% |
| Apache | 0.0 /100 | #334 | Tragic 73.7% |
| Ute | 0.0 /100 | #335 | Tragic 73.7% |
| Crow | 0.0 /100 | #336 | Tragic 73.3% |
| Yup'ik | 0.0 /100 | #337 | Tragic 73.2% |
| Puerto Ricans | 0.0 /100 | #338 | Tragic 73.1% |
| Houma | 0.0 /100 | #339 | Tragic 72.7% |