Immigrants from Belgium vs Immigrants from Sierra Leone In Labor Force | Age 16-19
COMPARE
Immigrants from Belgium
Immigrants from Sierra Leone
In Labor Force | Age 16-19
In Labor Force | Age 16-19 Comparison
Immigrants from Belgium
Immigrants from Sierra Leone
35.3%
IN LABOR FORCE | AGE 16-19
6.1/ 100
METRIC RATING
225th/ 347
METRIC RANK
37.3%
IN LABOR FORCE | AGE 16-19
83.6/ 100
METRIC RATING
152nd/ 347
METRIC RANK
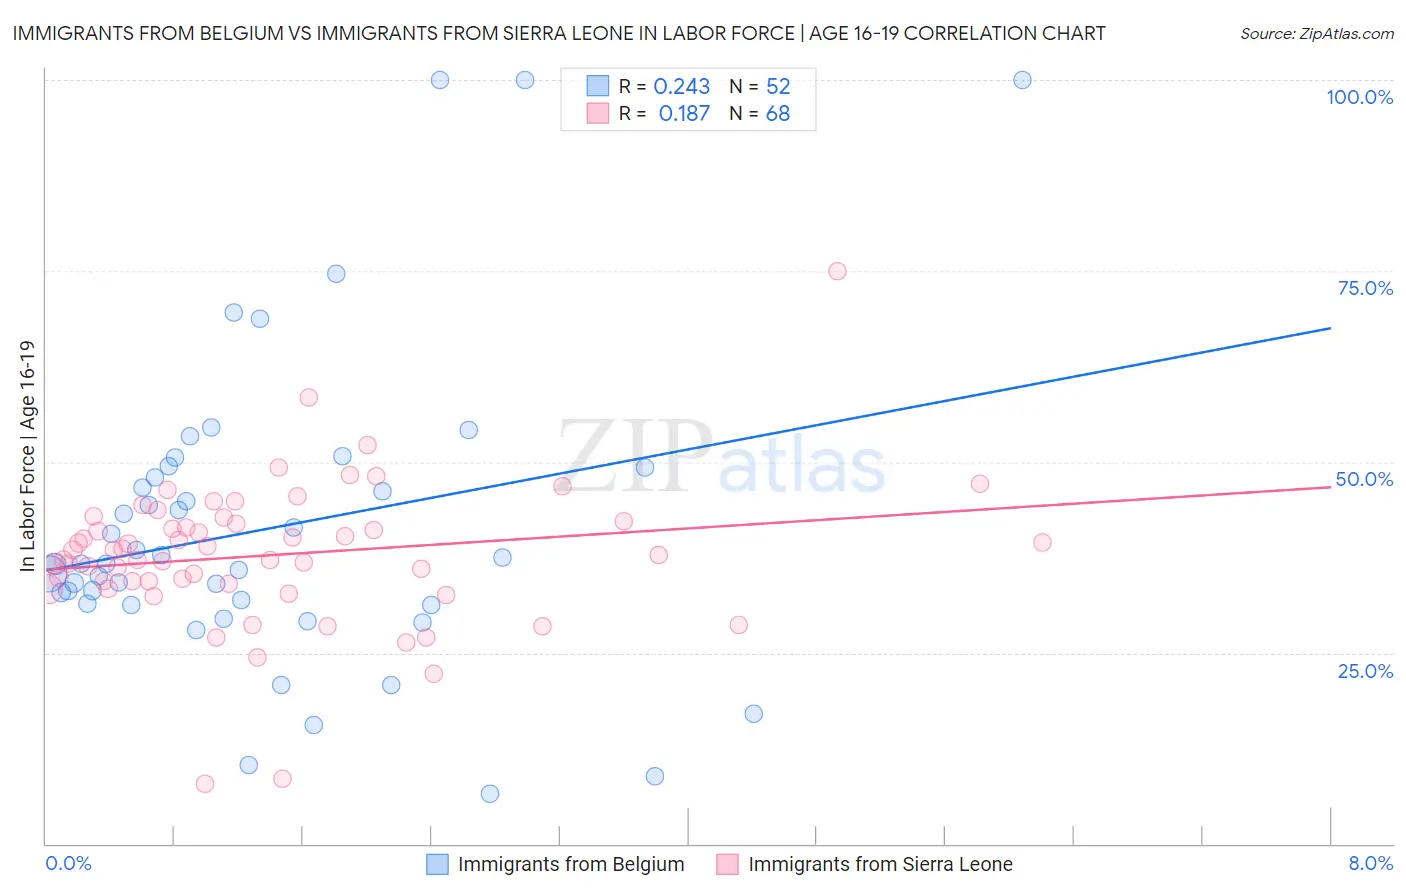
Immigrants from Belgium vs Immigrants from Sierra Leone In Labor Force | Age 16-19 Correlation Chart
The statistical analysis conducted on geographies consisting of 146,618,217 people shows a weak positive correlation between the proportion of Immigrants from Belgium and labor force participation rate among population between the ages 16 and 19 in the United States with a correlation coefficient (R) of 0.243 and weighted average of 35.3%. Similarly, the statistical analysis conducted on geographies consisting of 101,607,840 people shows a poor positive correlation between the proportion of Immigrants from Sierra Leone and labor force participation rate among population between the ages 16 and 19 in the United States with a correlation coefficient (R) of 0.187 and weighted average of 37.3%, a difference of 5.7%.
In Labor Force | Age 16-19 Correlation Summary
| Measurement | Immigrants from Belgium | Immigrants from Sierra Leone |
| Minimum | 6.6% | 7.9% |
| Maximum | 100.0% | 75.0% |
| Range | 93.4% | 67.1% |
| Mean | 41.3% | 37.8% |
| Median | 36.7% | 38.1% |
| Interquartile 25% (IQ1) | 31.4% | 34.2% |
| Interquartile 75% (IQ3) | 48.6% | 42.1% |
| Interquartile Range (IQR) | 17.2% | 7.9% |
| Standard Deviation (Sample) | 20.2% | 9.5% |
| Standard Deviation (Population) | 20.0% | 9.5% |
Similar Demographics by In Labor Force | Age 16-19
Demographics Similar to Immigrants from Belgium by In Labor Force | Age 16-19
In terms of in labor force | age 16-19, the demographic groups most similar to Immigrants from Belgium are Honduran (35.3%, a difference of 0.080%), Ghanaian (35.3%, a difference of 0.090%), Immigrants from Guatemala (35.3%, a difference of 0.090%), Mongolian (35.3%, a difference of 0.10%), and Immigrants from Senegal (35.3%, a difference of 0.15%).
| Demographics | Rating | Rank | In Labor Force | Age 16-19 |
| Sri Lankans | 9.8 /100 | #218 | Tragic 35.5% |
| Guatemalans | 8.6 /100 | #219 | Tragic 35.5% |
| Immigrants | Bahamas | 8.3 /100 | #220 | Tragic 35.5% |
| Turks | 7.3 /100 | #221 | Tragic 35.4% |
| Immigrants | Ghana | 7.3 /100 | #222 | Tragic 35.4% |
| Ghanaians | 6.5 /100 | #223 | Tragic 35.3% |
| Hondurans | 6.5 /100 | #224 | Tragic 35.3% |
| Immigrants | Belgium | 6.1 /100 | #225 | Tragic 35.3% |
| Immigrants | Guatemala | 5.7 /100 | #226 | Tragic 35.3% |
| Mongolians | 5.7 /100 | #227 | Tragic 35.3% |
| Immigrants | Senegal | 5.5 /100 | #228 | Tragic 35.3% |
| Immigrants | Lebanon | 5.0 /100 | #229 | Tragic 35.2% |
| Immigrants | Honduras | 4.9 /100 | #230 | Tragic 35.2% |
| Immigrants | Syria | 4.5 /100 | #231 | Tragic 35.2% |
| Immigrants | Kazakhstan | 4.5 /100 | #232 | Tragic 35.2% |
Demographics Similar to Immigrants from Sierra Leone by In Labor Force | Age 16-19
In terms of in labor force | age 16-19, the demographic groups most similar to Immigrants from Sierra Leone are Immigrants from Poland (37.3%, a difference of 0.070%), Tsimshian (37.4%, a difference of 0.10%), Native Hawaiian (37.4%, a difference of 0.13%), Arapaho (37.3%, a difference of 0.15%), and Immigrants from Bulgaria (37.3%, a difference of 0.17%).
| Demographics | Rating | Rank | In Labor Force | Age 16-19 |
| Paiute | 89.3 /100 | #145 | Excellent 37.5% |
| Immigrants | Western Europe | 88.9 /100 | #146 | Excellent 37.5% |
| Brazilians | 88.7 /100 | #147 | Excellent 37.5% |
| Romanians | 87.3 /100 | #148 | Excellent 37.5% |
| Native Hawaiians | 85.0 /100 | #149 | Excellent 37.4% |
| Tsimshian | 84.7 /100 | #150 | Excellent 37.4% |
| Immigrants | Poland | 84.4 /100 | #151 | Excellent 37.3% |
| Immigrants | Sierra Leone | 83.6 /100 | #152 | Excellent 37.3% |
| Arapaho | 81.8 /100 | #153 | Excellent 37.3% |
| Immigrants | Bulgaria | 81.6 /100 | #154 | Excellent 37.3% |
| Immigrants | Lithuania | 80.7 /100 | #155 | Excellent 37.2% |
| Kiowa | 80.4 /100 | #156 | Excellent 37.2% |
| Immigrants | Brazil | 76.5 /100 | #157 | Good 37.1% |
| Ute | 75.7 /100 | #158 | Good 37.1% |
| Yaqui | 74.4 /100 | #159 | Good 37.1% |