Immigrants from Belgium vs Immigrants from Ukraine Unemployment Among Women with Children Under 18 years
COMPARE
Immigrants from Belgium
Immigrants from Ukraine
Unemployment Among Women with Children Under 18 years
Unemployment Among Women with Children Under 18 years Comparison
Immigrants from Belgium
Immigrants from Ukraine
5.1%
UNEMPLOYMENT AMONG WOMEN WITH CHILDREN UNDER 18 YEARS
97.9/ 100
METRIC RATING
58th/ 347
METRIC RANK
5.3%
UNEMPLOYMENT AMONG WOMEN WITH CHILDREN UNDER 18 YEARS
78.5/ 100
METRIC RATING
139th/ 347
METRIC RANK
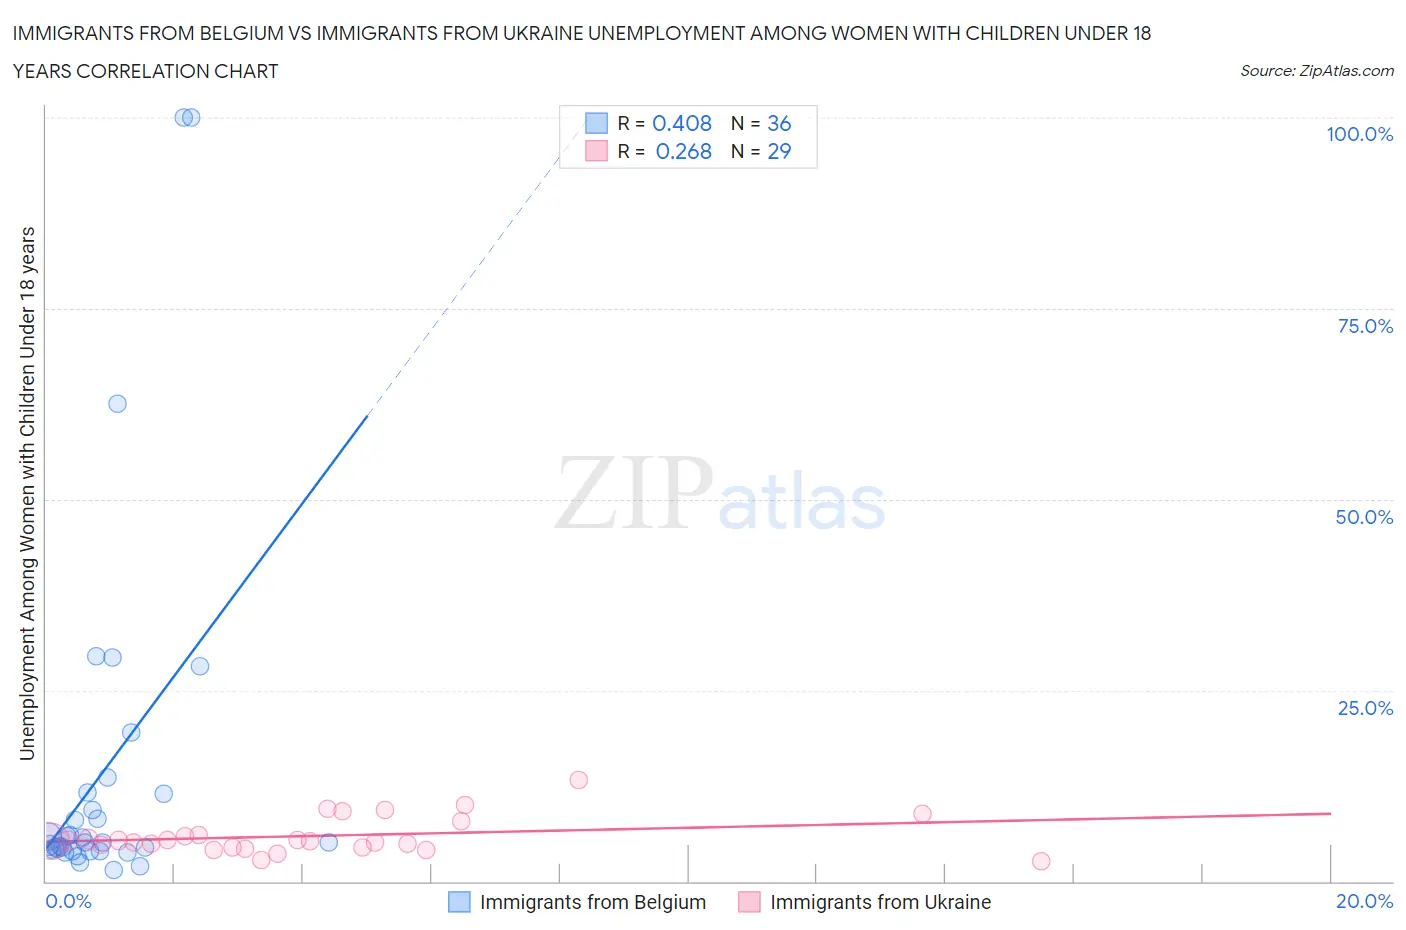
Immigrants from Belgium vs Immigrants from Ukraine Unemployment Among Women with Children Under 18 years Correlation Chart
The statistical analysis conducted on geographies consisting of 143,933,405 people shows a moderate positive correlation between the proportion of Immigrants from Belgium and unemployment rate among women with children under the age of 18 in the United States with a correlation coefficient (R) of 0.408 and weighted average of 5.1%. Similarly, the statistical analysis conducted on geographies consisting of 281,214,660 people shows a weak positive correlation between the proportion of Immigrants from Ukraine and unemployment rate among women with children under the age of 18 in the United States with a correlation coefficient (R) of 0.268 and weighted average of 5.3%, a difference of 4.8%.
Unemployment Among Women with Children Under 18 years Correlation Summary
| Measurement | Immigrants from Belgium | Immigrants from Ukraine |
| Minimum | 1.5% | 2.7% |
| Maximum | 100.0% | 13.2% |
| Range | 98.5% | 10.5% |
| Mean | 14.7% | 5.9% |
| Median | 5.1% | 5.3% |
| Interquartile 25% (IQ1) | 4.1% | 4.4% |
| Interquartile 75% (IQ3) | 11.5% | 6.9% |
| Interquartile Range (IQR) | 7.4% | 2.5% |
| Standard Deviation (Sample) | 24.0% | 2.4% |
| Standard Deviation (Population) | 23.7% | 2.4% |
Similar Demographics by Unemployment Among Women with Children Under 18 years
Demographics Similar to Immigrants from Belgium by Unemployment Among Women with Children Under 18 years
In terms of unemployment among women with children under 18 years, the demographic groups most similar to Immigrants from Belgium are Asian (5.1%, a difference of 0.020%), Czechoslovakian (5.1%, a difference of 0.080%), Immigrants from Ireland (5.1%, a difference of 0.14%), Welsh (5.1%, a difference of 0.17%), and Immigrants from Sri Lanka (5.1%, a difference of 0.18%).
| Demographics | Rating | Rank | Unemployment Among Women with Children Under 18 years |
| Yugoslavians | 98.3 /100 | #51 | Exceptional 5.1% |
| Immigrants | Nepal | 98.3 /100 | #52 | Exceptional 5.1% |
| Scottish | 98.2 /100 | #53 | Exceptional 5.1% |
| Immigrants | Serbia | 98.2 /100 | #54 | Exceptional 5.1% |
| Immigrants | Sri Lanka | 98.1 /100 | #55 | Exceptional 5.1% |
| Immigrants | Ireland | 98.0 /100 | #56 | Exceptional 5.1% |
| Czechoslovakians | 98.0 /100 | #57 | Exceptional 5.1% |
| Immigrants | Belgium | 97.9 /100 | #58 | Exceptional 5.1% |
| Asians | 97.9 /100 | #59 | Exceptional 5.1% |
| Welsh | 97.7 /100 | #60 | Exceptional 5.1% |
| Russians | 97.5 /100 | #61 | Exceptional 5.1% |
| Immigrants | Bulgaria | 97.4 /100 | #62 | Exceptional 5.1% |
| Italians | 97.4 /100 | #63 | Exceptional 5.1% |
| Estonians | 97.2 /100 | #64 | Exceptional 5.1% |
| Immigrants | Sweden | 97.1 /100 | #65 | Exceptional 5.1% |
Demographics Similar to Immigrants from Ukraine by Unemployment Among Women with Children Under 18 years
In terms of unemployment among women with children under 18 years, the demographic groups most similar to Immigrants from Ukraine are Jordanian (5.3%, a difference of 0.030%), Argentinean (5.3%, a difference of 0.030%), Immigrants from Jordan (5.3%, a difference of 0.11%), New Zealander (5.3%, a difference of 0.16%), and Slovak (5.3%, a difference of 0.22%).
| Demographics | Rating | Rank | Unemployment Among Women with Children Under 18 years |
| Immigrants | Ethiopia | 81.4 /100 | #132 | Excellent 5.3% |
| Ethiopians | 80.7 /100 | #133 | Excellent 5.3% |
| Slovaks | 80.5 /100 | #134 | Excellent 5.3% |
| New Zealanders | 79.9 /100 | #135 | Good 5.3% |
| Immigrants | Jordan | 79.5 /100 | #136 | Good 5.3% |
| Jordanians | 78.8 /100 | #137 | Good 5.3% |
| Argentineans | 78.8 /100 | #138 | Good 5.3% |
| Immigrants | Ukraine | 78.5 /100 | #139 | Good 5.3% |
| Immigrants | Norway | 76.2 /100 | #140 | Good 5.3% |
| Venezuelans | 76.0 /100 | #141 | Good 5.3% |
| Immigrants | Venezuela | 75.4 /100 | #142 | Good 5.3% |
| Chileans | 75.0 /100 | #143 | Good 5.3% |
| Immigrants | England | 74.9 /100 | #144 | Good 5.3% |
| Immigrants | Egypt | 74.0 /100 | #145 | Good 5.3% |
| Immigrants | Belarus | 73.4 /100 | #146 | Good 5.3% |