Cape Verdean vs Immigrants from Western Europe In Labor Force | Age 35-44
COMPARE
Cape Verdean
Immigrants from Western Europe
In Labor Force | Age 35-44
In Labor Force | Age 35-44 Comparison
Cape Verdeans
Immigrants from Western Europe
85.8%
IN LABOR FORCE | AGE 35-44
100.0/ 100
METRIC RATING
10th/ 347
METRIC RANK
84.2%
IN LABOR FORCE | AGE 35-44
24.7/ 100
METRIC RATING
197th/ 347
METRIC RANK
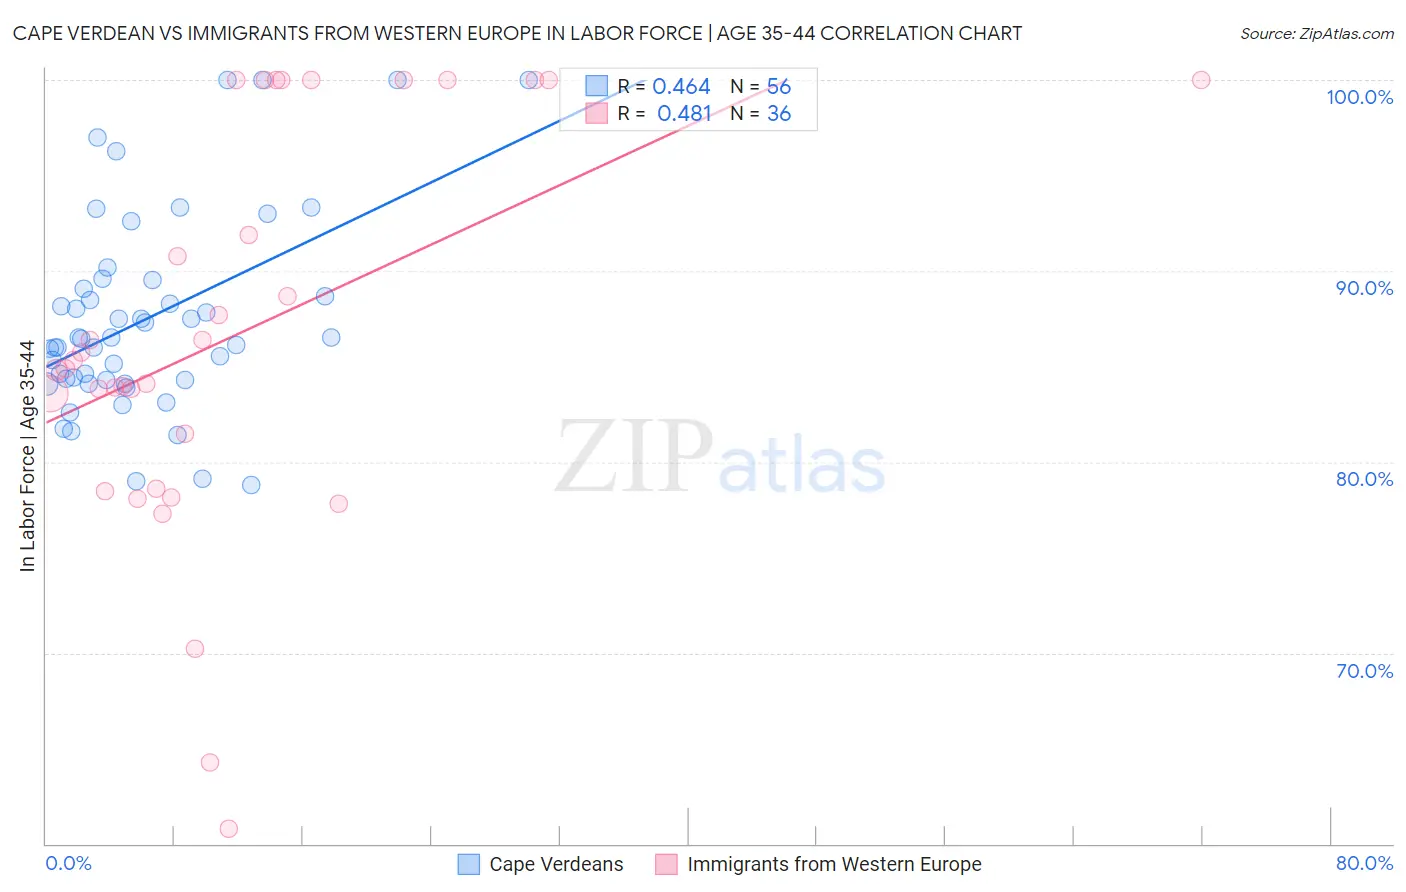
Cape Verdean vs Immigrants from Western Europe In Labor Force | Age 35-44 Correlation Chart
The statistical analysis conducted on geographies consisting of 107,550,182 people shows a moderate positive correlation between the proportion of Cape Verdeans and labor force participation rate among population between the ages 35 and 44 in the United States with a correlation coefficient (R) of 0.464 and weighted average of 85.8%. Similarly, the statistical analysis conducted on geographies consisting of 493,820,556 people shows a moderate positive correlation between the proportion of Immigrants from Western Europe and labor force participation rate among population between the ages 35 and 44 in the United States with a correlation coefficient (R) of 0.481 and weighted average of 84.2%, a difference of 1.9%.
In Labor Force | Age 35-44 Correlation Summary
| Measurement | Cape Verdean | Immigrants from Western Europe |
| Minimum | 78.8% | 60.8% |
| Maximum | 100.0% | 100.0% |
| Range | 21.2% | 39.2% |
| Mean | 87.5% | 86.7% |
| Median | 86.5% | 85.1% |
| Interquartile 25% (IQ1) | 84.3% | 80.1% |
| Interquartile 75% (IQ3) | 89.3% | 100.0% |
| Interquartile Range (IQR) | 5.0% | 19.9% |
| Standard Deviation (Sample) | 5.2% | 10.4% |
| Standard Deviation (Population) | 5.2% | 10.3% |
Similar Demographics by In Labor Force | Age 35-44
Demographics Similar to Cape Verdeans by In Labor Force | Age 35-44
In terms of in labor force | age 35-44, the demographic groups most similar to Cape Verdeans are Immigrants from Cameroon (85.8%, a difference of 0.030%), Immigrants from Ethiopia (85.9%, a difference of 0.13%), Ethiopian (85.9%, a difference of 0.13%), Liberian (85.7%, a difference of 0.15%), and Somali (85.6%, a difference of 0.17%).
| Demographics | Rating | Rank | In Labor Force | Age 35-44 |
| Immigrants | Bolivia | 100.0 /100 | #3 | Exceptional 86.2% |
| Immigrants | Cabo Verde | 100.0 /100 | #4 | Exceptional 86.2% |
| Zimbabweans | 100.0 /100 | #5 | Exceptional 86.1% |
| Bolivians | 100.0 /100 | #6 | Exceptional 86.1% |
| Immigrants | Sierra Leone | 100.0 /100 | #7 | Exceptional 86.1% |
| Immigrants | Ethiopia | 100.0 /100 | #8 | Exceptional 85.9% |
| Ethiopians | 100.0 /100 | #9 | Exceptional 85.9% |
| Cape Verdeans | 100.0 /100 | #10 | Exceptional 85.8% |
| Immigrants | Cameroon | 100.0 /100 | #11 | Exceptional 85.8% |
| Liberians | 100.0 /100 | #12 | Exceptional 85.7% |
| Somalis | 100.0 /100 | #13 | Exceptional 85.6% |
| Immigrants | Somalia | 100.0 /100 | #14 | Exceptional 85.6% |
| Norwegians | 100.0 /100 | #15 | Exceptional 85.6% |
| Immigrants | Ireland | 100.0 /100 | #16 | Exceptional 85.6% |
| Immigrants | North Macedonia | 100.0 /100 | #17 | Exceptional 85.6% |
Demographics Similar to Immigrants from Western Europe by In Labor Force | Age 35-44
In terms of in labor force | age 35-44, the demographic groups most similar to Immigrants from Western Europe are Immigrants from England (84.2%, a difference of 0.0%), Immigrants from Indonesia (84.2%, a difference of 0.010%), Immigrants from Caribbean (84.2%, a difference of 0.010%), Ecuadorian (84.2%, a difference of 0.010%), and Syrian (84.2%, a difference of 0.010%).
| Demographics | Rating | Rank | In Labor Force | Age 35-44 |
| Portuguese | 31.9 /100 | #190 | Fair 84.3% |
| Immigrants | Philippines | 27.9 /100 | #191 | Fair 84.2% |
| Immigrants | Vietnam | 27.4 /100 | #192 | Fair 84.2% |
| Hungarians | 26.8 /100 | #193 | Fair 84.2% |
| Immigrants | Indonesia | 25.7 /100 | #194 | Fair 84.2% |
| Immigrants | Caribbean | 25.7 /100 | #195 | Fair 84.2% |
| Immigrants | England | 25.0 /100 | #196 | Fair 84.2% |
| Immigrants | Western Europe | 24.7 /100 | #197 | Fair 84.2% |
| Ecuadorians | 24.0 /100 | #198 | Fair 84.2% |
| Syrians | 23.2 /100 | #199 | Fair 84.2% |
| Moroccans | 23.2 /100 | #200 | Fair 84.2% |
| British | 23.0 /100 | #201 | Fair 84.2% |
| Immigrants | Uzbekistan | 22.8 /100 | #202 | Fair 84.2% |
| Immigrants | South Eastern Asia | 22.4 /100 | #203 | Fair 84.2% |
| Canadians | 19.9 /100 | #204 | Poor 84.2% |