Immigrants from Belarus vs Immigrants from Western Europe No Schooling Completed
COMPARE
Immigrants from Belarus
Immigrants from Western Europe
No Schooling Completed
No Schooling Completed Comparison
Immigrants from Belarus
Immigrants from Western Europe
2.1%
NO SCHOOLING COMPLETED
51.8/ 100
METRIC RATING
173rd/ 347
METRIC RANK
1.8%
NO SCHOOLING COMPLETED
99.2/ 100
METRIC RATING
88th/ 347
METRIC RANK
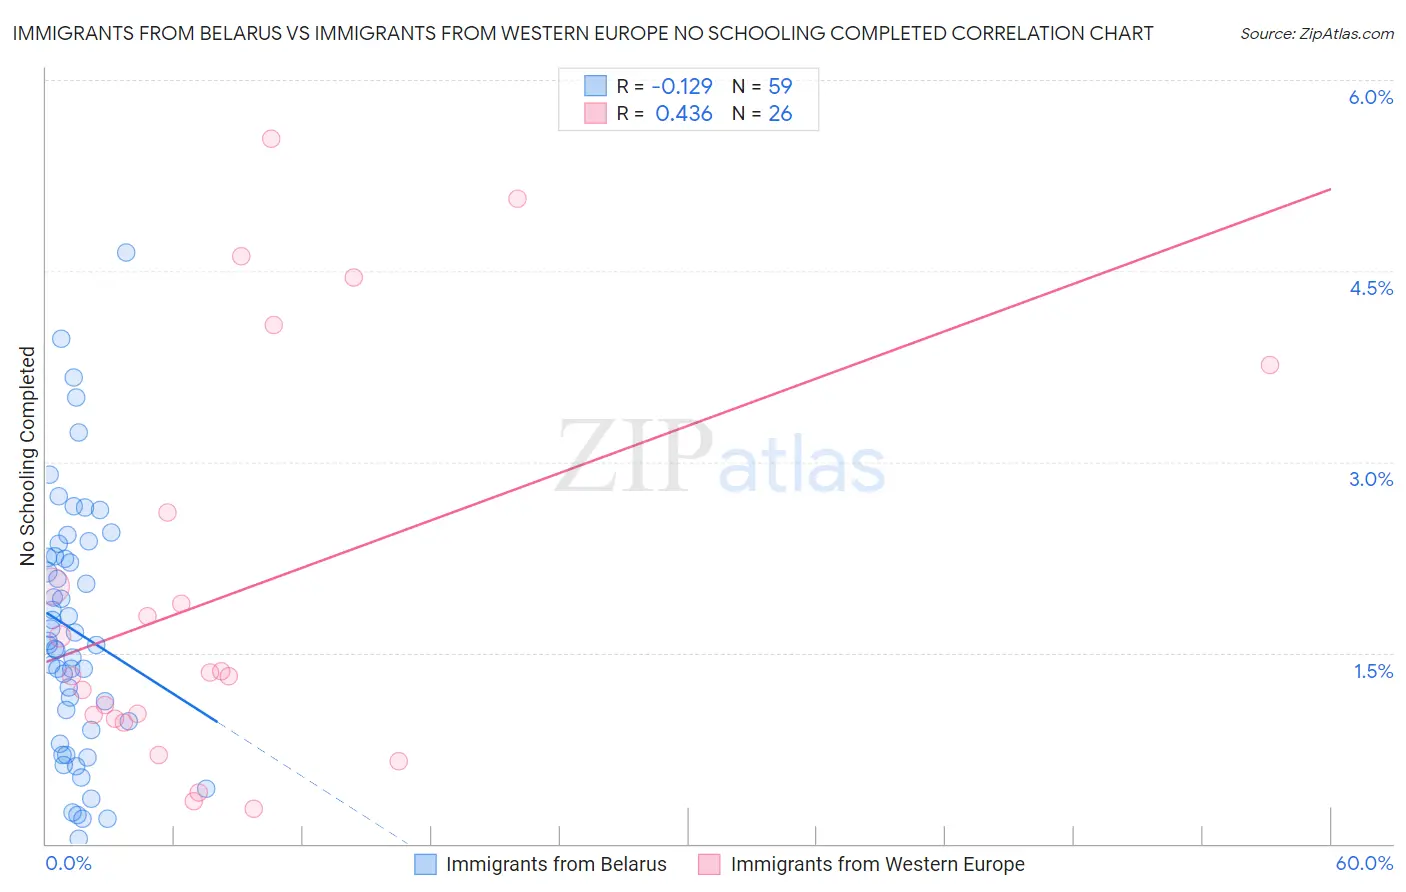
Immigrants from Belarus vs Immigrants from Western Europe No Schooling Completed Correlation Chart
The statistical analysis conducted on geographies consisting of 149,360,708 people shows a poor negative correlation between the proportion of Immigrants from Belarus and percentage of population with no schooling in the United States with a correlation coefficient (R) of -0.129 and weighted average of 2.1%. Similarly, the statistical analysis conducted on geographies consisting of 485,224,363 people shows a moderate positive correlation between the proportion of Immigrants from Western Europe and percentage of population with no schooling in the United States with a correlation coefficient (R) of 0.436 and weighted average of 1.8%, a difference of 18.8%.
No Schooling Completed Correlation Summary
| Measurement | Immigrants from Belarus | Immigrants from Western Europe |
| Minimum | 0.035% | 0.27% |
| Maximum | 4.6% | 5.5% |
| Range | 4.6% | 5.3% |
| Mean | 1.7% | 2.0% |
| Median | 1.6% | 1.3% |
| Interquartile 25% (IQ1) | 0.89% | 0.98% |
| Interquartile 75% (IQ3) | 2.3% | 2.6% |
| Interquartile Range (IQR) | 1.4% | 1.6% |
| Standard Deviation (Sample) | 1.00% | 1.6% |
| Standard Deviation (Population) | 0.99% | 1.5% |
Similar Demographics by No Schooling Completed
Demographics Similar to Immigrants from Belarus by No Schooling Completed
In terms of no schooling completed, the demographic groups most similar to Immigrants from Belarus are Immigrants from Argentina (2.1%, a difference of 0.13%), Immigrants from Micronesia (2.1%, a difference of 0.24%), Immigrants from Poland (2.1%, a difference of 0.46%), Argentinean (2.1%, a difference of 0.58%), and Apache (2.1%, a difference of 0.67%).
| Demographics | Rating | Rank | No Schooling Completed |
| Dutch West Indians | 59.9 /100 | #166 | Average 2.1% |
| Egyptians | 59.2 /100 | #167 | Average 2.1% |
| Cheyenne | 58.6 /100 | #168 | Average 2.1% |
| Apache | 56.7 /100 | #169 | Average 2.1% |
| Argentineans | 56.0 /100 | #170 | Average 2.1% |
| Immigrants | Poland | 55.2 /100 | #171 | Average 2.1% |
| Immigrants | Argentina | 52.7 /100 | #172 | Average 2.1% |
| Immigrants | Belarus | 51.8 /100 | #173 | Average 2.1% |
| Immigrants | Micronesia | 50.0 /100 | #174 | Average 2.1% |
| Arabs | 46.4 /100 | #175 | Average 2.1% |
| Panamanians | 45.2 /100 | #176 | Average 2.1% |
| Arapaho | 45.0 /100 | #177 | Average 2.1% |
| Pakistanis | 44.7 /100 | #178 | Average 2.1% |
| Immigrants | Kazakhstan | 44.3 /100 | #179 | Average 2.1% |
| Portuguese | 43.9 /100 | #180 | Average 2.1% |
Demographics Similar to Immigrants from Western Europe by No Schooling Completed
In terms of no schooling completed, the demographic groups most similar to Immigrants from Western Europe are Osage (1.8%, a difference of 0.040%), South African (1.8%, a difference of 0.040%), Ukrainian (1.8%, a difference of 0.36%), Immigrants from Australia (1.7%, a difference of 0.40%), and Immigrants from Denmark (1.7%, a difference of 0.44%).
| Demographics | Rating | Rank | No Schooling Completed |
| Icelanders | 99.3 /100 | #81 | Exceptional 1.7% |
| Immigrants | South Africa | 99.3 /100 | #82 | Exceptional 1.7% |
| Potawatomi | 99.3 /100 | #83 | Exceptional 1.7% |
| Immigrants | Denmark | 99.2 /100 | #84 | Exceptional 1.7% |
| Immigrants | Australia | 99.2 /100 | #85 | Exceptional 1.7% |
| Ukrainians | 99.2 /100 | #86 | Exceptional 1.8% |
| Osage | 99.2 /100 | #87 | Exceptional 1.8% |
| Immigrants | Western Europe | 99.2 /100 | #88 | Exceptional 1.8% |
| South Africans | 99.1 /100 | #89 | Exceptional 1.8% |
| Sioux | 99.0 /100 | #90 | Exceptional 1.8% |
| Immigrants | Germany | 99.0 /100 | #91 | Exceptional 1.8% |
| Romanians | 98.8 /100 | #92 | Exceptional 1.8% |
| Turks | 98.7 /100 | #93 | Exceptional 1.8% |
| Immigrants | Nonimmigrants | 98.5 /100 | #94 | Exceptional 1.8% |
| Puget Sound Salish | 98.5 /100 | #95 | Exceptional 1.8% |