Immigrants from Belarus vs Afghan Unemployment Among Women with Children Under 6 years
COMPARE
Immigrants from Belarus
Afghan
Unemployment Among Women with Children Under 6 years
Unemployment Among Women with Children Under 6 years Comparison
Immigrants from Belarus
Afghans
6.6%
UNEMPLOYMENT AMONG WOMEN WITH CHILDREN UNDER 6 YEARS
100.0/ 100
METRIC RATING
30th/ 347
METRIC RANK
7.0%
UNEMPLOYMENT AMONG WOMEN WITH CHILDREN UNDER 6 YEARS
99.4/ 100
METRIC RATING
71st/ 347
METRIC RANK
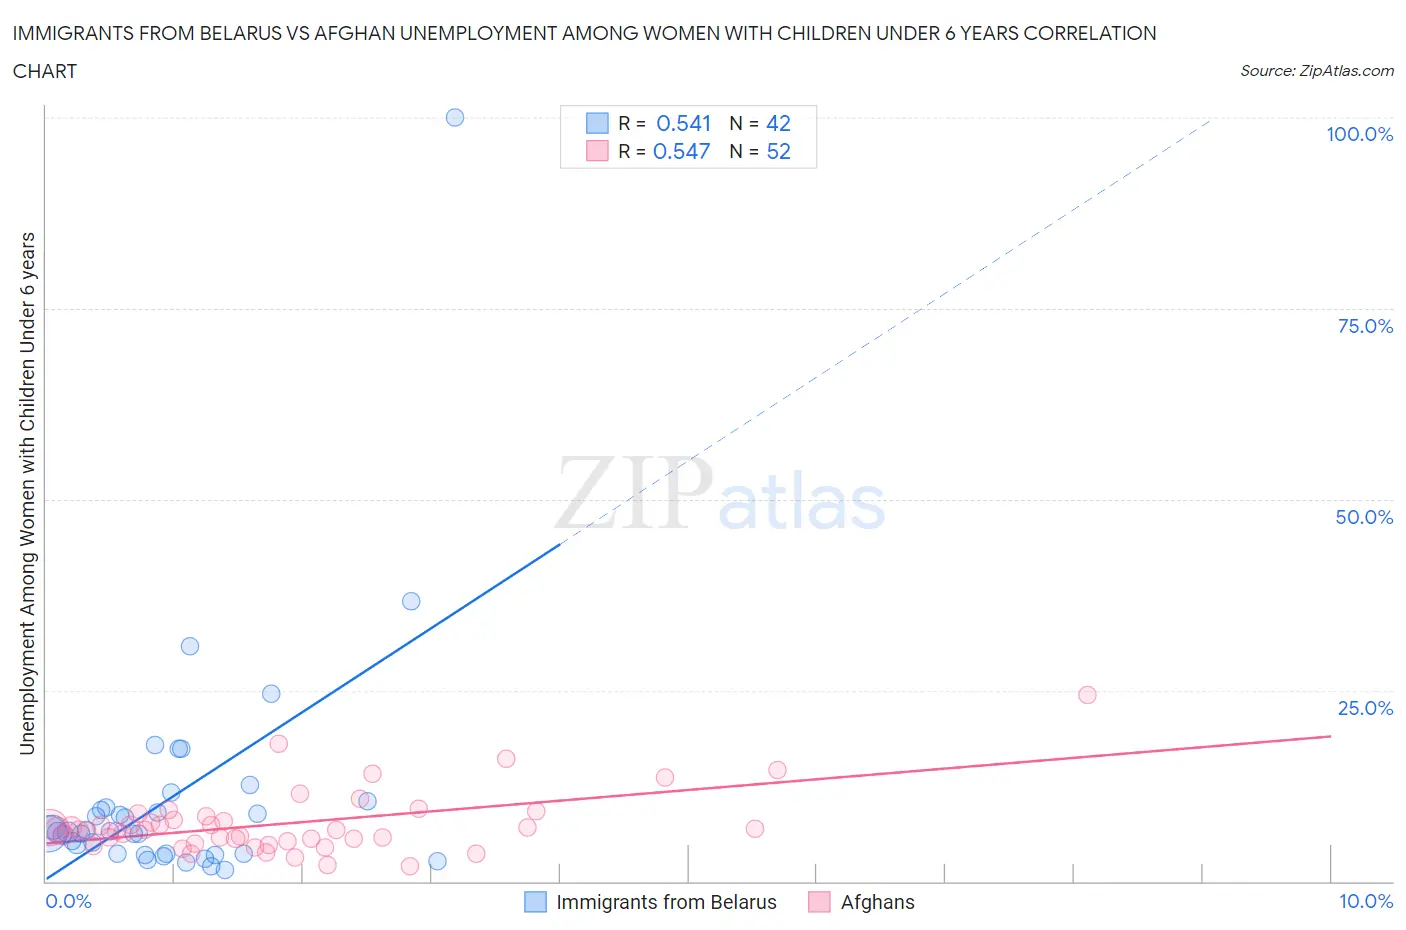
Immigrants from Belarus vs Afghan Unemployment Among Women with Children Under 6 years Correlation Chart
The statistical analysis conducted on geographies consisting of 129,688,046 people shows a substantial positive correlation between the proportion of Immigrants from Belarus and unemployment rate among women with children under the age of 6 in the United States with a correlation coefficient (R) of 0.541 and weighted average of 6.6%. Similarly, the statistical analysis conducted on geographies consisting of 133,713,490 people shows a substantial positive correlation between the proportion of Afghans and unemployment rate among women with children under the age of 6 in the United States with a correlation coefficient (R) of 0.547 and weighted average of 7.0%, a difference of 6.2%.
Unemployment Among Women with Children Under 6 years Correlation Summary
| Measurement | Immigrants from Belarus | Afghan |
| Minimum | 1.5% | 2.0% |
| Maximum | 100.0% | 24.4% |
| Range | 98.5% | 22.4% |
| Mean | 10.9% | 7.5% |
| Median | 6.4% | 6.7% |
| Interquartile 25% (IQ1) | 3.6% | 5.3% |
| Interquartile 75% (IQ3) | 9.7% | 8.3% |
| Interquartile Range (IQR) | 6.1% | 2.9% |
| Standard Deviation (Sample) | 15.9% | 4.1% |
| Standard Deviation (Population) | 15.7% | 4.1% |
Similar Demographics by Unemployment Among Women with Children Under 6 years
Demographics Similar to Immigrants from Belarus by Unemployment Among Women with Children Under 6 years
In terms of unemployment among women with children under 6 years, the demographic groups most similar to Immigrants from Belarus are Immigrants from Moldova (6.6%, a difference of 0.29%), Immigrants from Sweden (6.6%, a difference of 0.32%), Tsimshian (6.6%, a difference of 0.36%), Immigrants from Vietnam (6.6%, a difference of 0.38%), and Immigrants from South Central Asia (6.6%, a difference of 0.38%).
| Demographics | Rating | Rank | Unemployment Among Women with Children Under 6 years |
| Bulgarians | 100.0 /100 | #23 | Exceptional 6.5% |
| Laotians | 100.0 /100 | #24 | Exceptional 6.5% |
| Soviet Union | 100.0 /100 | #25 | Exceptional 6.5% |
| Cypriots | 100.0 /100 | #26 | Exceptional 6.5% |
| Immigrants | Japan | 100.0 /100 | #27 | Exceptional 6.5% |
| Immigrants | Israel | 100.0 /100 | #28 | Exceptional 6.5% |
| Immigrants | Sweden | 100.0 /100 | #29 | Exceptional 6.6% |
| Immigrants | Belarus | 100.0 /100 | #30 | Exceptional 6.6% |
| Immigrants | Moldova | 100.0 /100 | #31 | Exceptional 6.6% |
| Tsimshian | 100.0 /100 | #32 | Exceptional 6.6% |
| Immigrants | Vietnam | 100.0 /100 | #33 | Exceptional 6.6% |
| Immigrants | South Central Asia | 100.0 /100 | #34 | Exceptional 6.6% |
| Yakama | 100.0 /100 | #35 | Exceptional 6.6% |
| Luxembourgers | 100.0 /100 | #36 | Exceptional 6.6% |
| Sri Lankans | 100.0 /100 | #37 | Exceptional 6.6% |
Demographics Similar to Afghans by Unemployment Among Women with Children Under 6 years
In terms of unemployment among women with children under 6 years, the demographic groups most similar to Afghans are Immigrants from Iraq (7.0%, a difference of 0.020%), Immigrants from Eritrea (7.0%, a difference of 0.040%), Paraguayan (7.0%, a difference of 0.070%), Cuban (7.0%, a difference of 0.11%), and Immigrants from Netherlands (7.0%, a difference of 0.30%).
| Demographics | Rating | Rank | Unemployment Among Women with Children Under 6 years |
| Tongans | 99.7 /100 | #64 | Exceptional 6.9% |
| Immigrants | Kuwait | 99.7 /100 | #65 | Exceptional 6.9% |
| Immigrants | Belgium | 99.6 /100 | #66 | Exceptional 6.9% |
| Immigrants | Netherlands | 99.5 /100 | #67 | Exceptional 7.0% |
| Paraguayans | 99.4 /100 | #68 | Exceptional 7.0% |
| Immigrants | Eritrea | 99.4 /100 | #69 | Exceptional 7.0% |
| Immigrants | Iraq | 99.4 /100 | #70 | Exceptional 7.0% |
| Afghans | 99.4 /100 | #71 | Exceptional 7.0% |
| Cubans | 99.4 /100 | #72 | Exceptional 7.0% |
| Immigrants | Czechoslovakia | 99.2 /100 | #73 | Exceptional 7.0% |
| Turks | 99.2 /100 | #74 | Exceptional 7.0% |
| Immigrants | Eastern Europe | 99.0 /100 | #75 | Exceptional 7.1% |
| Estonians | 99.0 /100 | #76 | Exceptional 7.1% |
| Immigrants | Croatia | 98.9 /100 | #77 | Exceptional 7.1% |
| Immigrants | Somalia | 98.9 /100 | #78 | Exceptional 7.1% |