Immigrants from Barbados vs Panamanian In Labor Force | Age 35-44
COMPARE
Immigrants from Barbados
Panamanian
In Labor Force | Age 35-44
In Labor Force | Age 35-44 Comparison
Immigrants from Barbados
Panamanians
84.1%
IN LABOR FORCE | AGE 35-44
13.2/ 100
METRIC RATING
214th/ 347
METRIC RANK
84.0%
IN LABOR FORCE | AGE 35-44
5.4/ 100
METRIC RATING
226th/ 347
METRIC RANK
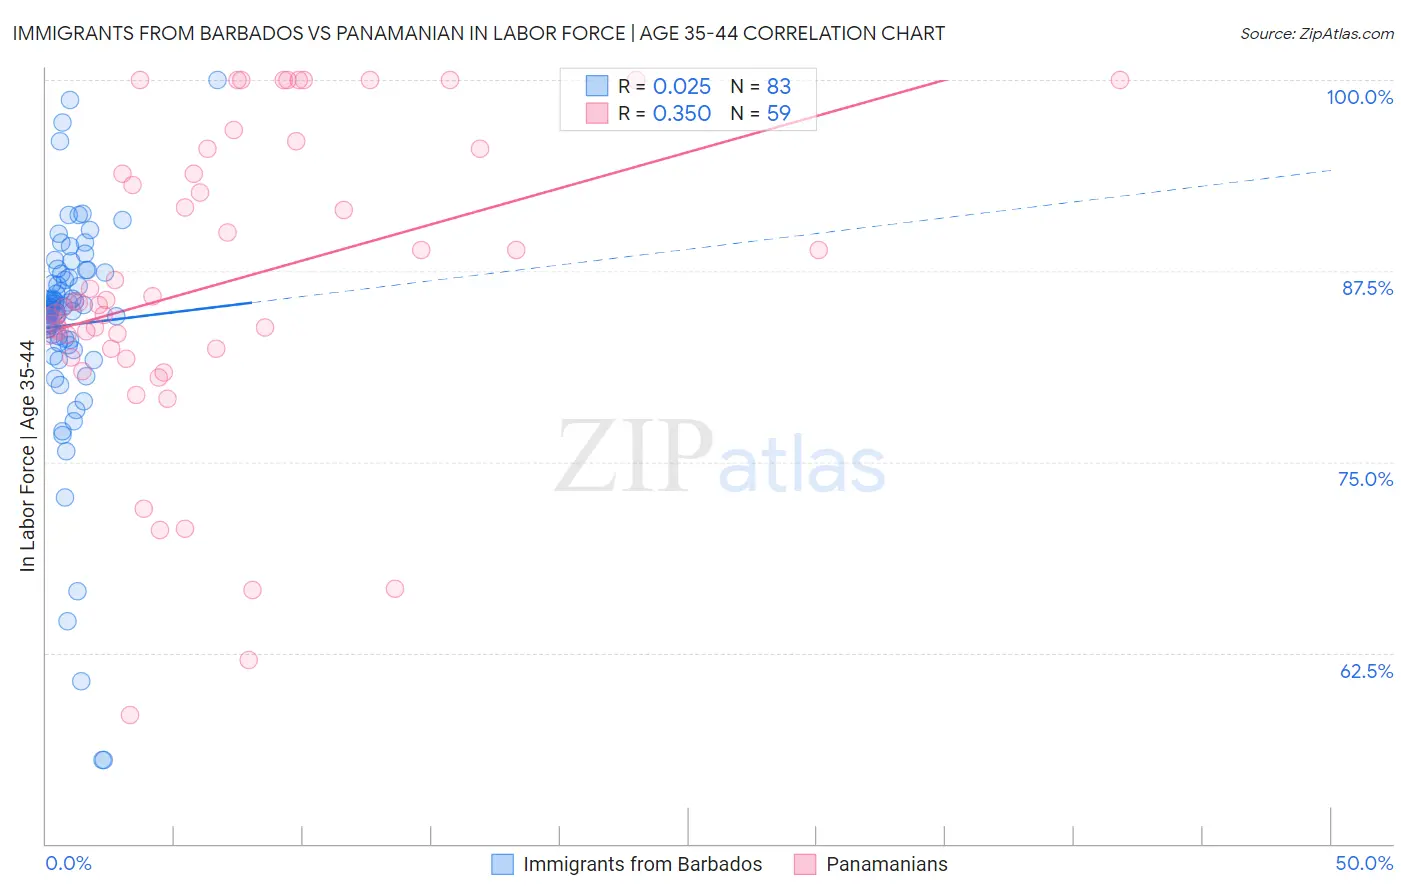
Immigrants from Barbados vs Panamanian In Labor Force | Age 35-44 Correlation Chart
The statistical analysis conducted on geographies consisting of 112,764,413 people shows no correlation between the proportion of Immigrants from Barbados and labor force participation rate among population between the ages 35 and 44 in the United States with a correlation coefficient (R) of 0.025 and weighted average of 84.1%. Similarly, the statistical analysis conducted on geographies consisting of 281,116,157 people shows a mild positive correlation between the proportion of Panamanians and labor force participation rate among population between the ages 35 and 44 in the United States with a correlation coefficient (R) of 0.350 and weighted average of 84.0%, a difference of 0.16%.
In Labor Force | Age 35-44 Correlation Summary
| Measurement | Immigrants from Barbados | Panamanian |
| Minimum | 55.5% | 58.4% |
| Maximum | 100.0% | 100.0% |
| Range | 44.5% | 41.6% |
| Mean | 84.0% | 86.7% |
| Median | 85.1% | 85.5% |
| Interquartile 25% (IQ1) | 82.8% | 82.4% |
| Interquartile 75% (IQ3) | 87.3% | 95.5% |
| Interquartile Range (IQR) | 4.5% | 13.1% |
| Standard Deviation (Sample) | 7.5% | 10.1% |
| Standard Deviation (Population) | 7.5% | 10.0% |
Demographics Similar to Immigrants from Barbados and Panamanians by In Labor Force | Age 35-44
In terms of in labor force | age 35-44, the demographic groups most similar to Immigrants from Barbados are Israeli (84.1%, a difference of 0.010%), Bangladeshi (84.1%, a difference of 0.010%), European (84.1%, a difference of 0.010%), Nicaraguan (84.1%, a difference of 0.020%), and Immigrants from Norway (84.1%, a difference of 0.020%). Similarly, the demographic groups most similar to Panamanians are British West Indian (84.0%, a difference of 0.0%), Welsh (84.0%, a difference of 0.0%), U.S. Virgin Islander (84.0%, a difference of 0.020%), Immigrants from Burma/Myanmar (84.0%, a difference of 0.020%), and Assyrian/Chaldean/Syriac (84.0%, a difference of 0.030%).
| Demographics | Rating | Rank | In Labor Force | Age 35-44 |
| New Zealanders | 16.2 /100 | #210 | Poor 84.1% |
| Immigrants | Ecuador | 15.2 /100 | #211 | Poor 84.1% |
| Israelis | 14.0 /100 | #212 | Poor 84.1% |
| Bangladeshis | 13.7 /100 | #213 | Poor 84.1% |
| Immigrants | Barbados | 13.2 /100 | #214 | Poor 84.1% |
| Europeans | 12.2 /100 | #215 | Poor 84.1% |
| Nicaraguans | 12.1 /100 | #216 | Poor 84.1% |
| Immigrants | Norway | 11.7 /100 | #217 | Poor 84.1% |
| Immigrants | Nicaragua | 9.4 /100 | #218 | Tragic 84.1% |
| Sub-Saharan Africans | 9.3 /100 | #219 | Tragic 84.1% |
| French | 7.5 /100 | #220 | Tragic 84.0% |
| Icelanders | 6.7 /100 | #221 | Tragic 84.0% |
| Assyrians/Chaldeans/Syriacs | 6.6 /100 | #222 | Tragic 84.0% |
| Immigrants | Panama | 6.4 /100 | #223 | Tragic 84.0% |
| U.S. Virgin Islanders | 6.1 /100 | #224 | Tragic 84.0% |
| Immigrants | Burma/Myanmar | 6.1 /100 | #225 | Tragic 84.0% |
| Panamanians | 5.4 /100 | #226 | Tragic 84.0% |
| British West Indians | 5.3 /100 | #227 | Tragic 84.0% |
| Welsh | 5.3 /100 | #228 | Tragic 84.0% |
| Immigrants | Thailand | 4.7 /100 | #229 | Tragic 84.0% |
| Immigrants | Iraq | 3.7 /100 | #230 | Tragic 83.9% |