Russian vs Immigrants from Asia In Labor Force | Age 35-44

COMPARE

Russian
Race
Ancestry
AfghanAfricanAlaska NativeAlaskan AthabascanAlbanianAleutAlsatianAmericanApacheArabArapahoArgentineanArmenianAssyrian/Chaldean/SyriacAustralianAustrianBahamianBangladeshiBarbadianBasqueBelgianBelizeanBermudanBhutaneseBlackfeetBolivianBrazilianBritishBritish West IndianBulgarianBurmeseCajunCambodianCanadianCape VerdeanCarpatho RusynCelticCentral AmericanCentral American IndianCherokeeCheyenneChickasawChileanChineseChippewaChoctawColombianColvilleComancheCosta RicanCreeCreekCroatianCrowCubanCypriotCzechCzechoslovakianDanishDelawareDominicanDutchDutch West IndianEastern EuropeanEcuadorianEgyptianEnglishEstonianEthiopianEuropeanFijianFilipinoFinnishFrenchFrench American IndianFrench CanadianGermanGerman RussianGhanaianGreekGuamanian/ChamorroGuatemalanGuyaneseHaitianHmongHonduranHopiHoumaHungarianIcelanderIndian (Asian)IndonesianInupiatIranianIraqiIrishIroquoisIsraeliItalianJamaicanJapaneseJordanianKenyanKiowaKoreanLaotianLatvianLebaneseLiberianLithuanianLumbeeLuxembourgerMacedonianMalaysianMalteseMarshalleseMenomineeMexicanMexican American IndianMongolianMoroccanNative HawaiianNavajoNepaleseNew ZealanderNicaraguanNigerianNorthern EuropeanNorwegianOkinawanOsageOttawaPaiutePakistaniPalestinianPanamanianParaguayanPennsylvania GermanPeruvianPimaPolishPortuguesePotawatomiPuebloPuerto RicanPuget Sound SalishRomanianRussianSalvadoranSamoanScandinavianScotch-IrishScottishSeminoleSenegaleseSerbianShoshoneSierra LeoneanSiouxSlavicSlovakSloveneSomaliSouth AfricanSouth AmericanSouth American IndianSoviet UnionSpaniardSpanishSpanish AmericanSpanish American IndianSri LankanSubsaharan AfricanSudaneseSwedishSwissSyrianTaiwaneseThaiTlingit-HaidaTohono O'OdhamTonganTrinidadian and TobagonianTsimshianTurkishU.S. Virgin IslanderUgandanUkrainianUruguayanUteVenezuelanVietnameseWelshWest IndianYakamaYaquiYugoslavianYumanYup'ikZimbabwean
Immigration
NonimmigrantsImmigrantsAfghanistanAfricaAlbaniaArgentinaArmeniaAustraliaAustriaBahamasBangladeshBarbadosBelarusBelgiumBelizeBoliviaBosnia and HerzegovinaBrazilBulgariaBurma/MyanmarCabo VerdeCambodiaCameroonCanadaCaribbeanCentral AmericaChileChinaColombiaCongoCosta RicaCroatiaCubaCzechoslovakiaDenmarkDominicaDominican RepublicEastern AfricaEastern AsiaEastern EuropeEcuadorEgyptEl SalvadorEnglandEritreaEthiopiaEuropeFijiFranceGermanyGhanaGreeceGrenadaGuatemalaGuyanaHaitiHondurasHong KongHungaryIndiaIndonesiaIranIraqIrelandIsraelItalyJamaicaJapanJordanKazakhstanKenyaKoreaKuwaitLaosLatin AmericaLatviaLebanonLiberiaLithuaniaMalaysiaMexicoMicronesiaMiddle AfricaMoldovaMoroccoNepalNetherlandsNicaraguaNigeriaNorth AmericaNorth MacedoniaNorthern AfricaNorthern EuropeNorwayOceaniaPakistanPanamaPeruPhilippinesPolandPortugalRomaniaRussiaSaudi ArabiaScotlandSenegalSerbiaSierra LeoneSingaporeSomaliaSouth AfricaSouth AmericaSouth Central AsiaSouth Eastern AsiaSouthern EuropeSpainSri LankaSt. Vincent and the GrenadinesSudanSwedenSwitzerlandSyriaTaiwanThailandTrinidad and TobagoTurkeyUgandaUkraineUruguayUzbekistanVenezuelaVietnamWest IndiesWestern AfricaWestern AsiaWestern EuropeYemenZaireZimbabweAzores
Immigrants from Asia
Race
Ancestry
AfghanAfricanAlaska NativeAlaskan AthabascanAlbanianAleutAlsatianAmericanApacheArabArapahoArgentineanArmenianAssyrian/Chaldean/SyriacAustralianAustrianBahamianBangladeshiBarbadianBasqueBelgianBelizeanBermudanBhutaneseBlackfeetBolivianBrazilianBritishBritish West IndianBulgarianBurmeseCajunCambodianCanadianCape VerdeanCarpatho RusynCelticCentral AmericanCentral American IndianCherokeeCheyenneChickasawChileanChineseChippewaChoctawColombianColvilleComancheCosta RicanCreeCreekCroatianCrowCubanCypriotCzechCzechoslovakianDanishDelawareDominicanDutchDutch West IndianEastern EuropeanEcuadorianEgyptianEnglishEstonianEthiopianEuropeanFijianFilipinoFinnishFrenchFrench American IndianFrench CanadianGermanGerman RussianGhanaianGreekGuamanian/ChamorroGuatemalanGuyaneseHaitianHmongHonduranHopiHoumaHungarianIcelanderIndian (Asian)IndonesianInupiatIranianIraqiIrishIroquoisIsraeliItalianJamaicanJapaneseJordanianKenyanKiowaKoreanLaotianLatvianLebaneseLiberianLithuanianLumbeeLuxembourgerMacedonianMalaysianMalteseMarshalleseMenomineeMexicanMexican American IndianMongolianMoroccanNative HawaiianNavajoNepaleseNew ZealanderNicaraguanNigerianNorthern EuropeanNorwegianOkinawanOsageOttawaPaiutePakistaniPalestinianPanamanianParaguayanPennsylvania GermanPeruvianPimaPolishPortuguesePotawatomiPuebloPuerto RicanPuget Sound SalishRomanianSalvadoranSamoanScandinavianScotch-IrishScottishSeminoleSenegaleseSerbianShoshoneSierra LeoneanSiouxSlavicSlovakSloveneSomaliSouth AfricanSouth AmericanSouth American IndianSoviet UnionSpaniardSpanishSpanish AmericanSpanish American IndianSri LankanSubsaharan AfricanSudaneseSwedishSwissSyrianTaiwaneseThaiTlingit-HaidaTohono O'OdhamTonganTrinidadian and TobagonianTsimshianTurkishU.S. Virgin IslanderUgandanUkrainianUruguayanUteVenezuelanVietnameseWelshWest IndianYakamaYaquiYugoslavianYumanYup'ikZimbabwean
Immigration
NonimmigrantsImmigrantsAfghanistanAfricaAlbaniaArgentinaArmeniaAsiaAustraliaAustriaBahamasBangladeshBarbadosBelarusBelgiumBelizeBoliviaBosnia and HerzegovinaBrazilBulgariaBurma/MyanmarCabo VerdeCambodiaCameroonCanadaCaribbeanCentral AmericaChileChinaColombiaCongoCosta RicaCroatiaCubaCzechoslovakiaDenmarkDominicaDominican RepublicEastern AfricaEastern AsiaEastern EuropeEcuadorEgyptEl SalvadorEnglandEritreaEthiopiaEuropeFijiFranceGermanyGhanaGreeceGrenadaGuatemalaGuyanaHaitiHondurasHong KongHungaryIndiaIndonesiaIranIraqIrelandIsraelItalyJamaicaJapanJordanKazakhstanKenyaKoreaKuwaitLaosLatin AmericaLatviaLebanonLiberiaLithuaniaMalaysiaMexicoMicronesiaMiddle AfricaMoldovaMoroccoNepalNetherlandsNicaraguaNigeriaNorth AmericaNorth MacedoniaNorthern AfricaNorthern EuropeNorwayOceaniaPakistanPanamaPeruPhilippinesPolandPortugalRomaniaRussiaSaudi ArabiaScotlandSenegalSerbiaSierra LeoneSingaporeSomaliaSouth AfricaSouth AmericaSouth Central AsiaSouth Eastern AsiaSouthern EuropeSpainSri LankaSt. Vincent and the GrenadinesSudanSwedenSwitzerlandSyriaTaiwanThailandTrinidad and TobagoTurkeyUgandaUkraineUruguayUzbekistanVenezuelaVietnamWest IndiesWestern AfricaWestern AsiaWestern EuropeYemenZaireZimbabweAzores
In Labor Force | Age 35-44
Income
Poverty
Unemployment
Labor Participation
Family Structure
Vehicle Availability
Education Level
Disability

In Labor Force | Age 35-44 Comparison

Russians

Immigrants from Asia

Exceptional
Good
85.0%
IN LABOR FORCE | AGE 35-44
99.0/ 100
METRIC RATING
71st/ 347
METRIC RANK
84.5%
IN LABOR FORCE | AGE 35-44
78.7/ 100
METRIC RATING
146th/ 347
METRIC RANK

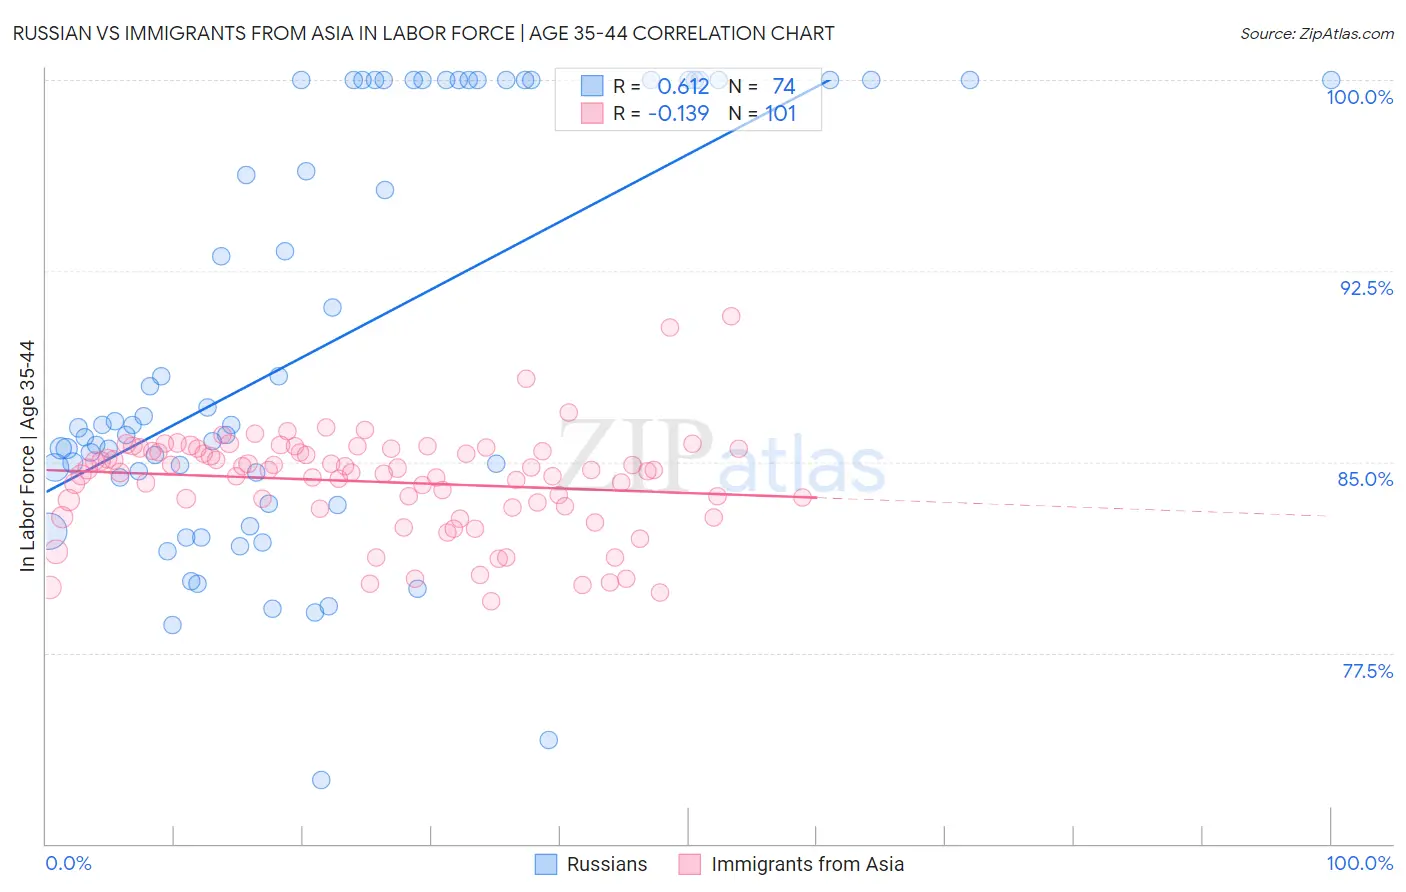
Russian vs Immigrants from Asia In Labor Force | Age 35-44 Correlation Chart

The statistical analysis conducted on geographies consisting of 511,787,854 people shows a significant positive correlation between the proportion of Russians and labor force participation rate among population between the ages 35 and 44 in the United States with a correlation coefficient (R) of 0.612 and weighted average of 85.0%. Similarly, the statistical analysis conducted on geographies consisting of 548,607,472 people shows a poor negative correlation between the proportion of Immigrants from Asia and labor force participation rate among population between the ages 35 and 44 in the United States with a correlation coefficient (R) of -0.139 and weighted average of 84.5%, a difference of 0.53%.
Russian vs Immigrants from Asia In Labor Force | Age 35-44

In Labor Force | Age 35-44 Correlation Summary

MeasurementRussianImmigrants from Asia
Minimum72.5%79.5%
Maximum100.0%90.7%
Range27.5%11.2%
Mean89.6%84.2%
Median86.5%84.7%
Interquartile 25% (IQ1)84.4%83.2%
Interquartile 75% (IQ3)100.0%85.5%
Interquartile Range (IQR)15.6%2.2%
Standard Deviation (Sample)8.1%2.0%
Standard Deviation (Population)8.0%2.0%

Similar Demographics by In Labor Force | Age 35-44

Demographics Similar to Russians by In Labor Force | Age 35-44

In terms of in labor force | age 35-44, the demographic groups most similar to Russians are Brazilian (85.0%, a difference of 0.0%), Sudanese (85.0%, a difference of 0.010%), Immigrants from Italy (85.0%, a difference of 0.020%), Italian (85.0%, a difference of 0.020%), and Immigrants from Singapore (85.0%, a difference of 0.020%).
DemographicsRating | RankIn Labor Force | Age 35-44
Swedes
99.2
/100
|
#64
Exceptional
85.0%
Immigrants | Brazil
99.2
/100
|
#65
Exceptional
85.0%
Immigrants | Haiti
99.1
/100
|
#66
Exceptional
85.0%
Immigrants | Italy
99.1
/100
|
#67
Exceptional
85.0%
Italians
99.1
/100
|
#68
Exceptional
85.0%
Sudanese
99.0
/100
|
#69
Exceptional
85.0%
Brazilians
99.0
/100
|
#70
Exceptional
85.0%
Russians
99.0
/100
|
#71
Exceptional
85.0%
Immigrants | Singapore
98.9
/100
|
#72
Exceptional
85.0%
Immigrants | Sri Lanka
98.9
/100
|
#73
Exceptional
85.0%
Colombians
98.8
/100
|
#74
Exceptional
85.0%
Immigrants | South Central Asia
98.7
/100
|
#75
Exceptional
85.0%
Immigrants | Cuba
98.6
/100
|
#76
Exceptional
84.9%
Immigrants | Turkey
98.6
/100
|
#77
Exceptional
84.9%
Immigrants | Africa
98.4
/100
|
#78
Exceptional
84.9%

Demographics Similar to Immigrants from Asia by In Labor Force | Age 35-44

In terms of in labor force | age 35-44, the demographic groups most similar to Immigrants from Asia are Immigrants from Uruguay (84.6%, a difference of 0.010%), Immigrants from Ukraine (84.6%, a difference of 0.010%), Immigrants from Jamaica (84.6%, a difference of 0.010%), Immigrants from Saudi Arabia (84.6%, a difference of 0.010%), and Immigrants from Belgium (84.6%, a difference of 0.020%).
DemographicsRating | RankIn Labor Force | Age 35-44
Immigrants | Zaire
82.5
/100
|
#139
Excellent
84.6%
Immigrants | Japan
81.4
/100
|
#140
Excellent
84.6%
Immigrants | Belgium
80.8
/100
|
#141
Excellent
84.6%
Immigrants | Uruguay
80.1
/100
|
#142
Excellent
84.6%
Immigrants | Ukraine
79.7
/100
|
#143
Good
84.6%
Immigrants | Jamaica
79.4
/100
|
#144
Good
84.6%
Immigrants | Saudi Arabia
79.4
/100
|
#145
Good
84.6%
Immigrants | Asia
78.7
/100
|
#146
Good
84.5%
Immigrants | Netherlands
76.6
/100
|
#147
Good
84.5%
South American Indians
73.6
/100
|
#148
Good
84.5%
Okinawans
73.5
/100
|
#149
Good
84.5%
Immigrants | Nigeria
73.3
/100
|
#150
Good
84.5%
Romanians
72.1
/100
|
#151
Good
84.5%
Immigrants | Taiwan
71.4
/100
|
#152
Good
84.5%
Trinidadians and Tobagonians
69.5
/100
|
#153
Good
84.5%