Australian vs Immigrants from Asia In Labor Force | Age 35-44
COMPARE
Australian
Immigrants from Asia
In Labor Force | Age 35-44
In Labor Force | Age 35-44 Comparison
Australians
Immigrants from Asia
84.3%
IN LABOR FORCE | AGE 35-44
35.1/ 100
METRIC RATING
186th/ 347
METRIC RANK
84.5%
IN LABOR FORCE | AGE 35-44
78.7/ 100
METRIC RATING
146th/ 347
METRIC RANK
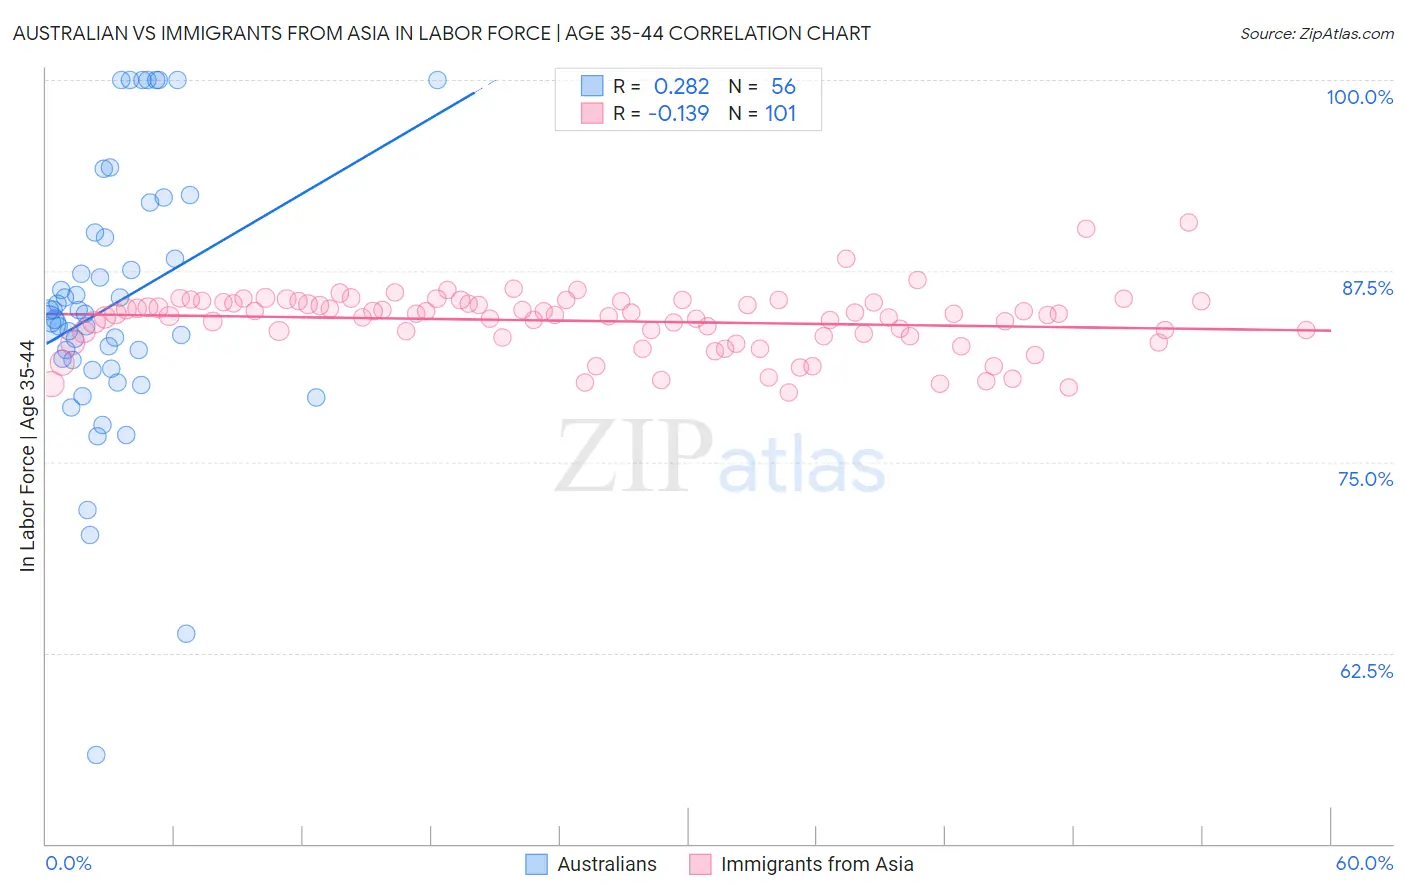
Australian vs Immigrants from Asia In Labor Force | Age 35-44 Correlation Chart
The statistical analysis conducted on geographies consisting of 224,086,573 people shows a weak positive correlation between the proportion of Australians and labor force participation rate among population between the ages 35 and 44 in the United States with a correlation coefficient (R) of 0.282 and weighted average of 84.3%. Similarly, the statistical analysis conducted on geographies consisting of 548,607,472 people shows a poor negative correlation between the proportion of Immigrants from Asia and labor force participation rate among population between the ages 35 and 44 in the United States with a correlation coefficient (R) of -0.139 and weighted average of 84.5%, a difference of 0.31%.
In Labor Force | Age 35-44 Correlation Summary
| Measurement | Australian | Immigrants from Asia |
| Minimum | 55.8% | 79.5% |
| Maximum | 100.0% | 90.7% |
| Range | 44.2% | 11.2% |
| Mean | 85.4% | 84.2% |
| Median | 84.5% | 84.7% |
| Interquartile 25% (IQ1) | 81.4% | 83.2% |
| Interquartile 75% (IQ3) | 89.8% | 85.5% |
| Interquartile Range (IQR) | 8.5% | 2.2% |
| Standard Deviation (Sample) | 8.9% | 2.0% |
| Standard Deviation (Population) | 8.8% | 2.0% |
Similar Demographics by In Labor Force | Age 35-44
Demographics Similar to Australians by In Labor Force | Age 35-44
In terms of in labor force | age 35-44, the demographic groups most similar to Australians are Armenian (84.3%, a difference of 0.0%), Costa Rican (84.3%, a difference of 0.0%), Dutch (84.3%, a difference of 0.0%), Immigrants from West Indies (84.3%, a difference of 0.010%), and Korean (84.3%, a difference of 0.010%).
| Demographics | Rating | Rank | In Labor Force | Age 35-44 |
| Immigrants | South Africa | 42.8 /100 | #179 | Average 84.3% |
| Danes | 38.8 /100 | #180 | Fair 84.3% |
| Immigrants | West Indies | 36.4 /100 | #181 | Fair 84.3% |
| Koreans | 36.3 /100 | #182 | Fair 84.3% |
| Barbadians | 36.2 /100 | #183 | Fair 84.3% |
| Armenians | 35.6 /100 | #184 | Fair 84.3% |
| Costa Ricans | 35.3 /100 | #185 | Fair 84.3% |
| Australians | 35.1 /100 | #186 | Fair 84.3% |
| Dutch | 34.8 /100 | #187 | Fair 84.3% |
| South Africans | 34.1 /100 | #188 | Fair 84.3% |
| Immigrants | Denmark | 33.7 /100 | #189 | Fair 84.3% |
| Portuguese | 31.9 /100 | #190 | Fair 84.3% |
| Immigrants | Philippines | 27.9 /100 | #191 | Fair 84.2% |
| Immigrants | Vietnam | 27.4 /100 | #192 | Fair 84.2% |
| Hungarians | 26.8 /100 | #193 | Fair 84.2% |
Demographics Similar to Immigrants from Asia by In Labor Force | Age 35-44
In terms of in labor force | age 35-44, the demographic groups most similar to Immigrants from Asia are Immigrants from Uruguay (84.6%, a difference of 0.010%), Immigrants from Ukraine (84.6%, a difference of 0.010%), Immigrants from Jamaica (84.6%, a difference of 0.010%), Immigrants from Saudi Arabia (84.6%, a difference of 0.010%), and Immigrants from Belgium (84.6%, a difference of 0.020%).
| Demographics | Rating | Rank | In Labor Force | Age 35-44 |
| Immigrants | Zaire | 82.5 /100 | #139 | Excellent 84.6% |
| Immigrants | Japan | 81.4 /100 | #140 | Excellent 84.6% |
| Immigrants | Belgium | 80.8 /100 | #141 | Excellent 84.6% |
| Immigrants | Uruguay | 80.1 /100 | #142 | Excellent 84.6% |
| Immigrants | Ukraine | 79.7 /100 | #143 | Good 84.6% |
| Immigrants | Jamaica | 79.4 /100 | #144 | Good 84.6% |
| Immigrants | Saudi Arabia | 79.4 /100 | #145 | Good 84.6% |
| Immigrants | Asia | 78.7 /100 | #146 | Good 84.5% |
| Immigrants | Netherlands | 76.6 /100 | #147 | Good 84.5% |
| South American Indians | 73.6 /100 | #148 | Good 84.5% |
| Okinawans | 73.5 /100 | #149 | Good 84.5% |
| Immigrants | Nigeria | 73.3 /100 | #150 | Good 84.5% |
| Romanians | 72.1 /100 | #151 | Good 84.5% |
| Immigrants | Taiwan | 71.4 /100 | #152 | Good 84.5% |
| Trinidadians and Tobagonians | 69.5 /100 | #153 | Good 84.5% |