Immigrants from Bangladesh vs Immigrants from Poland In Labor Force | Age 35-44
COMPARE
Immigrants from Bangladesh
Immigrants from Poland
In Labor Force | Age 35-44
In Labor Force | Age 35-44 Comparison
Immigrants from Bangladesh
Immigrants from Poland
82.9%
IN LABOR FORCE | AGE 35-44
0.0/ 100
METRIC RATING
286th/ 347
METRIC RANK
85.2%
IN LABOR FORCE | AGE 35-44
99.8/ 100
METRIC RATING
38th/ 347
METRIC RANK
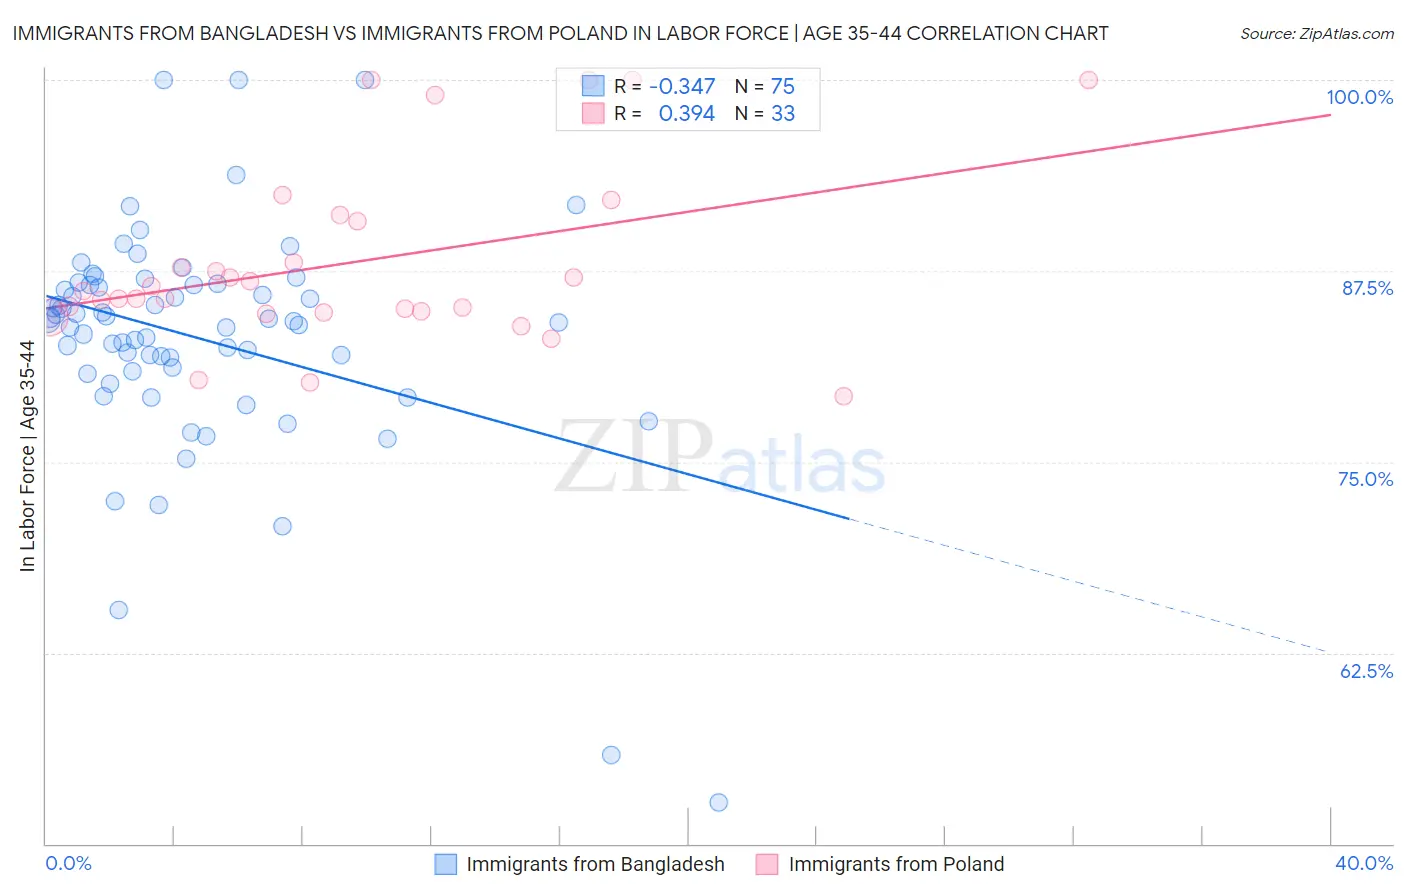
Immigrants from Bangladesh vs Immigrants from Poland In Labor Force | Age 35-44 Correlation Chart
The statistical analysis conducted on geographies consisting of 203,615,335 people shows a mild negative correlation between the proportion of Immigrants from Bangladesh and labor force participation rate among population between the ages 35 and 44 in the United States with a correlation coefficient (R) of -0.347 and weighted average of 82.9%. Similarly, the statistical analysis conducted on geographies consisting of 304,792,655 people shows a mild positive correlation between the proportion of Immigrants from Poland and labor force participation rate among population between the ages 35 and 44 in the United States with a correlation coefficient (R) of 0.394 and weighted average of 85.2%, a difference of 2.8%.
In Labor Force | Age 35-44 Correlation Summary
| Measurement | Immigrants from Bangladesh | Immigrants from Poland |
| Minimum | 52.7% | 79.3% |
| Maximum | 100.0% | 100.0% |
| Range | 47.3% | 20.7% |
| Mean | 83.1% | 88.1% |
| Median | 84.2% | 86.2% |
| Interquartile 25% (IQ1) | 81.0% | 84.9% |
| Interquartile 75% (IQ3) | 86.6% | 90.9% |
| Interquartile Range (IQR) | 5.6% | 6.1% |
| Standard Deviation (Sample) | 7.6% | 5.8% |
| Standard Deviation (Population) | 7.5% | 5.7% |
Similar Demographics by In Labor Force | Age 35-44
Demographics Similar to Immigrants from Bangladesh by In Labor Force | Age 35-44
In terms of in labor force | age 35-44, the demographic groups most similar to Immigrants from Bangladesh are Fijian (82.9%, a difference of 0.0%), Immigrants from Belize (82.9%, a difference of 0.0%), Immigrants from Dominican Republic (82.9%, a difference of 0.010%), Osage (82.9%, a difference of 0.020%), and Immigrants from Guatemala (82.9%, a difference of 0.020%).
| Demographics | Rating | Rank | In Labor Force | Age 35-44 |
| Immigrants | Micronesia | 0.0 /100 | #279 | Tragic 83.1% |
| Dominicans | 0.0 /100 | #280 | Tragic 83.1% |
| Guatemalans | 0.0 /100 | #281 | Tragic 83.0% |
| Osage | 0.0 /100 | #282 | Tragic 82.9% |
| Immigrants | Guatemala | 0.0 /100 | #283 | Tragic 82.9% |
| Immigrants | Dominican Republic | 0.0 /100 | #284 | Tragic 82.9% |
| Fijians | 0.0 /100 | #285 | Tragic 82.9% |
| Immigrants | Bangladesh | 0.0 /100 | #286 | Tragic 82.9% |
| Immigrants | Belize | 0.0 /100 | #287 | Tragic 82.9% |
| Puget Sound Salish | 0.0 /100 | #288 | Tragic 82.9% |
| Chippewa | 0.0 /100 | #289 | Tragic 82.9% |
| Africans | 0.0 /100 | #290 | Tragic 82.9% |
| Pennsylvania Germans | 0.0 /100 | #291 | Tragic 82.9% |
| Immigrants | Latin America | 0.0 /100 | #292 | Tragic 82.8% |
| Spanish Americans | 0.0 /100 | #293 | Tragic 82.8% |
Demographics Similar to Immigrants from Poland by In Labor Force | Age 35-44
In terms of in labor force | age 35-44, the demographic groups most similar to Immigrants from Poland are Eastern European (85.2%, a difference of 0.0%), Kenyan (85.2%, a difference of 0.010%), Immigrants from Bulgaria (85.2%, a difference of 0.010%), Immigrants from Zimbabwe (85.2%, a difference of 0.010%), and Macedonian (85.2%, a difference of 0.010%).
| Demographics | Rating | Rank | In Labor Force | Age 35-44 |
| Czechs | 99.9 /100 | #31 | Exceptional 85.3% |
| Immigrants | India | 99.9 /100 | #32 | Exceptional 85.3% |
| Ugandans | 99.9 /100 | #33 | Exceptional 85.3% |
| Immigrants | Nepal | 99.9 /100 | #34 | Exceptional 85.3% |
| Estonians | 99.9 /100 | #35 | Exceptional 85.3% |
| Immigrants | Morocco | 99.8 /100 | #36 | Exceptional 85.2% |
| Kenyans | 99.8 /100 | #37 | Exceptional 85.2% |
| Immigrants | Poland | 99.8 /100 | #38 | Exceptional 85.2% |
| Eastern Europeans | 99.8 /100 | #39 | Exceptional 85.2% |
| Immigrants | Bulgaria | 99.8 /100 | #40 | Exceptional 85.2% |
| Immigrants | Zimbabwe | 99.8 /100 | #41 | Exceptional 85.2% |
| Macedonians | 99.8 /100 | #42 | Exceptional 85.2% |
| Poles | 99.8 /100 | #43 | Exceptional 85.2% |
| Lithuanians | 99.8 /100 | #44 | Exceptional 85.2% |
| Cypriots | 99.8 /100 | #45 | Exceptional 85.2% |