Immigrants from Bahamas vs Immigrants from West Indies In Labor Force | Age 25-29
COMPARE
Immigrants from Bahamas
Immigrants from West Indies
In Labor Force | Age 25-29
In Labor Force | Age 25-29 Comparison
Immigrants from Bahamas
Immigrants from West Indies
83.6%
IN LABOR FORCE | AGE 25-29
0.1/ 100
METRIC RATING
260th/ 347
METRIC RANK
84.2%
IN LABOR FORCE | AGE 25-29
6.0/ 100
METRIC RATING
224th/ 347
METRIC RANK
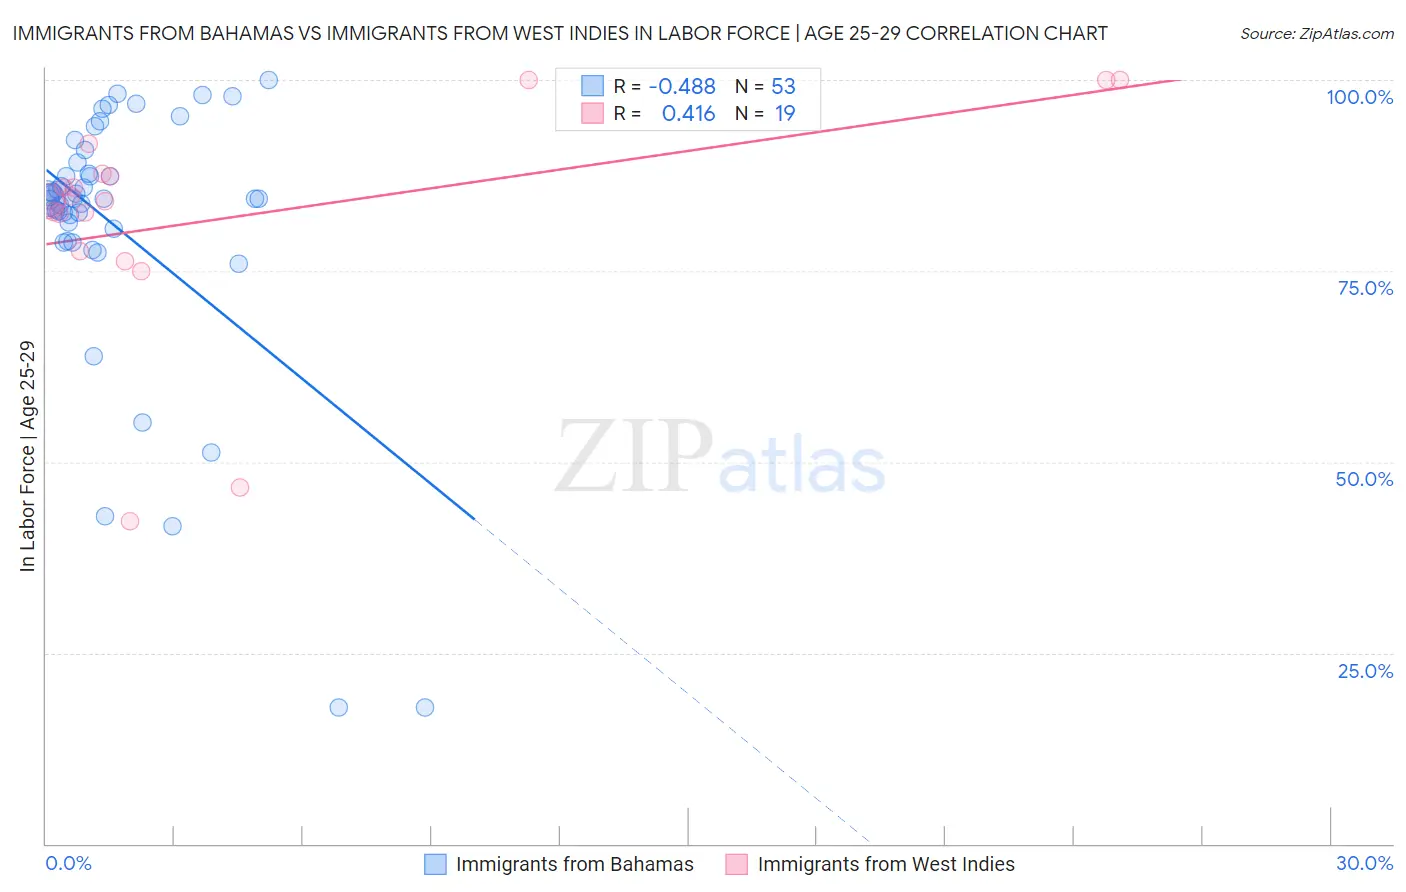
Immigrants from Bahamas vs Immigrants from West Indies In Labor Force | Age 25-29 Correlation Chart
The statistical analysis conducted on geographies consisting of 104,655,808 people shows a moderate negative correlation between the proportion of Immigrants from Bahamas and labor force participation rate among population between the ages 25 and 29 in the United States with a correlation coefficient (R) of -0.488 and weighted average of 83.6%. Similarly, the statistical analysis conducted on geographies consisting of 72,456,461 people shows a moderate positive correlation between the proportion of Immigrants from West Indies and labor force participation rate among population between the ages 25 and 29 in the United States with a correlation coefficient (R) of 0.416 and weighted average of 84.2%, a difference of 0.73%.
In Labor Force | Age 25-29 Correlation Summary
| Measurement | Immigrants from Bahamas | Immigrants from West Indies |
| Minimum | 17.9% | 42.2% |
| Maximum | 100.0% | 100.0% |
| Range | 82.1% | 57.8% |
| Mean | 80.7% | 82.0% |
| Median | 84.4% | 84.2% |
| Interquartile 25% (IQ1) | 79.7% | 77.6% |
| Interquartile 75% (IQ3) | 88.5% | 87.8% |
| Interquartile Range (IQR) | 8.8% | 10.2% |
| Standard Deviation (Sample) | 17.6% | 15.1% |
| Standard Deviation (Population) | 17.4% | 14.7% |
Similar Demographics by In Labor Force | Age 25-29
Demographics Similar to Immigrants from Bahamas by In Labor Force | Age 25-29
In terms of in labor force | age 25-29, the demographic groups most similar to Immigrants from Bahamas are Pennsylvania German (83.6%, a difference of 0.0%), Spanish (83.6%, a difference of 0.010%), Immigrants from Guatemala (83.6%, a difference of 0.020%), Immigrants from Haiti (83.7%, a difference of 0.060%), and Delaware (83.7%, a difference of 0.060%).
| Demographics | Rating | Rank | In Labor Force | Age 25-29 |
| Immigrants | Trinidad and Tobago | 0.2 /100 | #253 | Tragic 83.7% |
| Spaniards | 0.2 /100 | #254 | Tragic 83.7% |
| Haitians | 0.2 /100 | #255 | Tragic 83.7% |
| Immigrants | Haiti | 0.2 /100 | #256 | Tragic 83.7% |
| Delaware | 0.2 /100 | #257 | Tragic 83.7% |
| Immigrants | Guatemala | 0.1 /100 | #258 | Tragic 83.6% |
| Spanish | 0.1 /100 | #259 | Tragic 83.6% |
| Immigrants | Bahamas | 0.1 /100 | #260 | Tragic 83.6% |
| Pennsylvania Germans | 0.1 /100 | #261 | Tragic 83.6% |
| Immigrants | Fiji | 0.1 /100 | #262 | Tragic 83.6% |
| West Indians | 0.1 /100 | #263 | Tragic 83.5% |
| Puget Sound Salish | 0.1 /100 | #264 | Tragic 83.5% |
| Cubans | 0.1 /100 | #265 | Tragic 83.5% |
| Aleuts | 0.0 /100 | #266 | Tragic 83.4% |
| Spanish Americans | 0.0 /100 | #267 | Tragic 83.4% |
Demographics Similar to Immigrants from West Indies by In Labor Force | Age 25-29
In terms of in labor force | age 25-29, the demographic groups most similar to Immigrants from West Indies are Scotch-Irish (84.2%, a difference of 0.010%), Korean (84.2%, a difference of 0.010%), Immigrants from Congo (84.2%, a difference of 0.010%), Arab (84.2%, a difference of 0.020%), and Jordanian (84.2%, a difference of 0.020%).
| Demographics | Rating | Rank | In Labor Force | Age 25-29 |
| Immigrants | Ecuador | 9.3 /100 | #217 | Tragic 84.3% |
| Immigrants | Nigeria | 9.0 /100 | #218 | Tragic 84.3% |
| Immigrants | Saudi Arabia | 8.8 /100 | #219 | Tragic 84.3% |
| Nigerians | 7.2 /100 | #220 | Tragic 84.3% |
| Arabs | 6.8 /100 | #221 | Tragic 84.2% |
| Jordanians | 6.7 /100 | #222 | Tragic 84.2% |
| Scotch-Irish | 6.5 /100 | #223 | Tragic 84.2% |
| Immigrants | West Indies | 6.0 /100 | #224 | Tragic 84.2% |
| Koreans | 5.9 /100 | #225 | Tragic 84.2% |
| Immigrants | Congo | 5.8 /100 | #226 | Tragic 84.2% |
| French American Indians | 5.5 /100 | #227 | Tragic 84.2% |
| Immigrants | Panama | 5.5 /100 | #228 | Tragic 84.2% |
| Immigrants | Oceania | 5.0 /100 | #229 | Tragic 84.2% |
| Whites/Caucasians | 4.8 /100 | #230 | Tragic 84.2% |
| Immigrants | Philippines | 4.7 /100 | #231 | Tragic 84.2% |