Immigrants from Bahamas vs Immigrants from Jordan In Labor Force | Age 25-29
COMPARE
Immigrants from Bahamas
Immigrants from Jordan
In Labor Force | Age 25-29
In Labor Force | Age 25-29 Comparison
Immigrants from Bahamas
Immigrants from Jordan
83.6%
IN LABOR FORCE | AGE 25-29
0.1/ 100
METRIC RATING
260th/ 347
METRIC RANK
84.4%
IN LABOR FORCE | AGE 25-29
12.8/ 100
METRIC RATING
209th/ 347
METRIC RANK
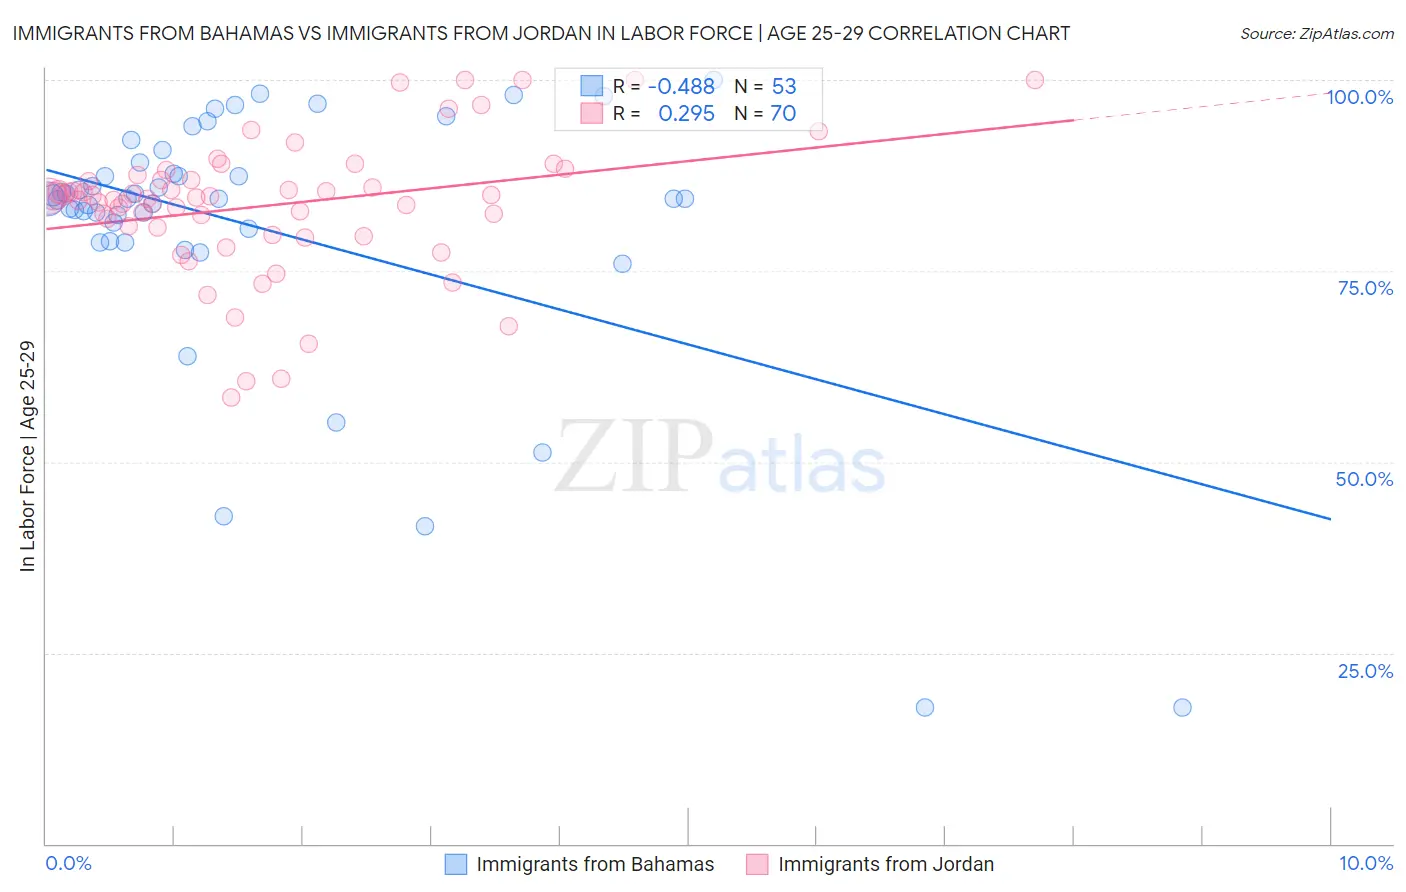
Immigrants from Bahamas vs Immigrants from Jordan In Labor Force | Age 25-29 Correlation Chart
The statistical analysis conducted on geographies consisting of 104,655,808 people shows a moderate negative correlation between the proportion of Immigrants from Bahamas and labor force participation rate among population between the ages 25 and 29 in the United States with a correlation coefficient (R) of -0.488 and weighted average of 83.6%. Similarly, the statistical analysis conducted on geographies consisting of 181,276,232 people shows a weak positive correlation between the proportion of Immigrants from Jordan and labor force participation rate among population between the ages 25 and 29 in the United States with a correlation coefficient (R) of 0.295 and weighted average of 84.4%, a difference of 0.89%.
In Labor Force | Age 25-29 Correlation Summary
| Measurement | Immigrants from Bahamas | Immigrants from Jordan |
| Minimum | 17.9% | 58.5% |
| Maximum | 100.0% | 100.0% |
| Range | 82.1% | 41.5% |
| Mean | 80.7% | 83.6% |
| Median | 84.4% | 84.7% |
| Interquartile 25% (IQ1) | 79.7% | 80.7% |
| Interquartile 75% (IQ3) | 88.5% | 86.9% |
| Interquartile Range (IQR) | 8.8% | 6.2% |
| Standard Deviation (Sample) | 17.6% | 8.8% |
| Standard Deviation (Population) | 17.4% | 8.7% |
Similar Demographics by In Labor Force | Age 25-29
Demographics Similar to Immigrants from Bahamas by In Labor Force | Age 25-29
In terms of in labor force | age 25-29, the demographic groups most similar to Immigrants from Bahamas are Pennsylvania German (83.6%, a difference of 0.0%), Spanish (83.6%, a difference of 0.010%), Immigrants from Guatemala (83.6%, a difference of 0.020%), Immigrants from Haiti (83.7%, a difference of 0.060%), and Delaware (83.7%, a difference of 0.060%).
| Demographics | Rating | Rank | In Labor Force | Age 25-29 |
| Immigrants | Trinidad and Tobago | 0.2 /100 | #253 | Tragic 83.7% |
| Spaniards | 0.2 /100 | #254 | Tragic 83.7% |
| Haitians | 0.2 /100 | #255 | Tragic 83.7% |
| Immigrants | Haiti | 0.2 /100 | #256 | Tragic 83.7% |
| Delaware | 0.2 /100 | #257 | Tragic 83.7% |
| Immigrants | Guatemala | 0.1 /100 | #258 | Tragic 83.6% |
| Spanish | 0.1 /100 | #259 | Tragic 83.6% |
| Immigrants | Bahamas | 0.1 /100 | #260 | Tragic 83.6% |
| Pennsylvania Germans | 0.1 /100 | #261 | Tragic 83.6% |
| Immigrants | Fiji | 0.1 /100 | #262 | Tragic 83.6% |
| West Indians | 0.1 /100 | #263 | Tragic 83.5% |
| Puget Sound Salish | 0.1 /100 | #264 | Tragic 83.5% |
| Cubans | 0.1 /100 | #265 | Tragic 83.5% |
| Aleuts | 0.0 /100 | #266 | Tragic 83.4% |
| Spanish Americans | 0.0 /100 | #267 | Tragic 83.4% |
Demographics Similar to Immigrants from Jordan by In Labor Force | Age 25-29
In terms of in labor force | age 25-29, the demographic groups most similar to Immigrants from Jordan are Chinese (84.3%, a difference of 0.0%), Immigrants from Venezuela (84.3%, a difference of 0.0%), Immigrants from Armenia (84.4%, a difference of 0.010%), Immigrants from Indonesia (84.4%, a difference of 0.010%), and Immigrants from Cambodia (84.4%, a difference of 0.020%).
| Demographics | Rating | Rank | In Labor Force | Age 25-29 |
| Afghans | 15.9 /100 | #202 | Poor 84.4% |
| Immigrants | Afghanistan | 15.6 /100 | #203 | Poor 84.4% |
| Venezuelans | 15.1 /100 | #204 | Poor 84.4% |
| Ecuadorians | 14.8 /100 | #205 | Poor 84.4% |
| Immigrants | Cambodia | 14.3 /100 | #206 | Poor 84.4% |
| Immigrants | Armenia | 13.3 /100 | #207 | Poor 84.4% |
| Immigrants | Indonesia | 13.2 /100 | #208 | Poor 84.4% |
| Immigrants | Jordan | 12.8 /100 | #209 | Poor 84.4% |
| Chinese | 12.7 /100 | #210 | Poor 84.3% |
| Immigrants | Venezuela | 12.6 /100 | #211 | Poor 84.3% |
| Sub-Saharan Africans | 11.7 /100 | #212 | Poor 84.3% |
| Japanese | 11.4 /100 | #213 | Poor 84.3% |
| Lebanese | 11.1 /100 | #214 | Poor 84.3% |
| Immigrants | Syria | 10.7 /100 | #215 | Poor 84.3% |
| Israelis | 9.3 /100 | #216 | Tragic 84.3% |