Immigrants from the Azores vs Immigrants from Zaire In Labor Force | Age 16-19
COMPARE
Immigrants from the Azores
Immigrants from Zaire
In Labor Force | Age 16-19
In Labor Force | Age 16-19 Comparison
Immigrants from the Azores
Immigrants from Zaire
41.7%
IN LABOR FORCE | AGE 16-19
100.0/ 100
METRIC RATING
36th/ 347
METRIC RANK
40.7%
IN LABOR FORCE | AGE 16-19
100.0/ 100
METRIC RATING
51st/ 347
METRIC RANK
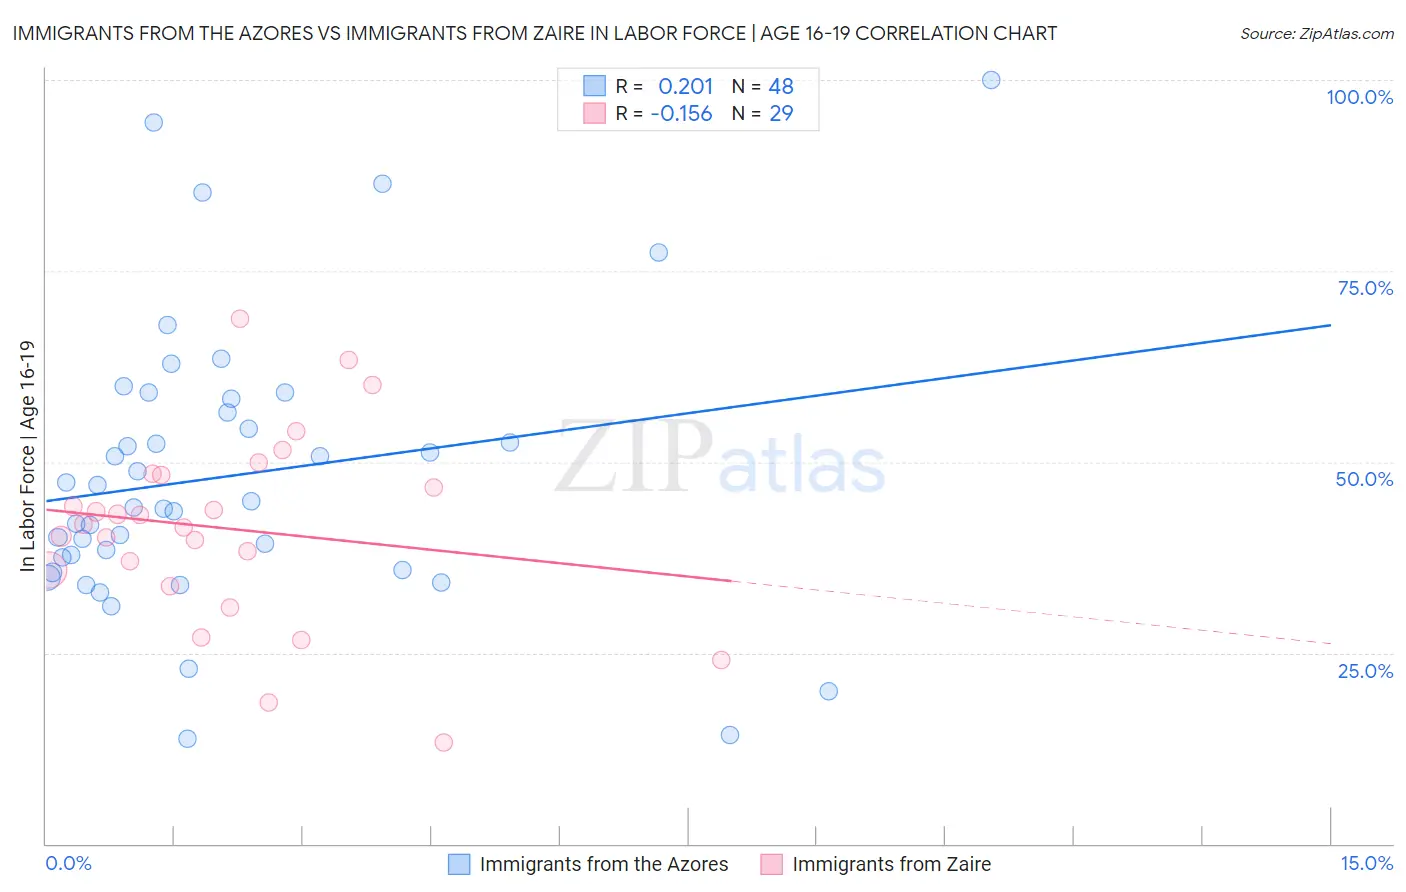
Immigrants from the Azores vs Immigrants from Zaire In Labor Force | Age 16-19 Correlation Chart
The statistical analysis conducted on geographies consisting of 46,224,998 people shows a weak positive correlation between the proportion of Immigrants from the Azores and labor force participation rate among population between the ages 16 and 19 in the United States with a correlation coefficient (R) of 0.201 and weighted average of 41.7%. Similarly, the statistical analysis conducted on geographies consisting of 107,243,431 people shows a poor negative correlation between the proportion of Immigrants from Zaire and labor force participation rate among population between the ages 16 and 19 in the United States with a correlation coefficient (R) of -0.156 and weighted average of 40.7%, a difference of 2.6%.
In Labor Force | Age 16-19 Correlation Summary
| Measurement | Immigrants from the Azores | Immigrants from Zaire |
| Minimum | 13.8% | 13.3% |
| Maximum | 100.0% | 68.8% |
| Range | 86.2% | 55.5% |
| Mean | 48.2% | 41.3% |
| Median | 44.4% | 41.8% |
| Interquartile 25% (IQ1) | 36.7% | 34.8% |
| Interquartile 75% (IQ3) | 57.4% | 48.3% |
| Interquartile Range (IQR) | 20.7% | 13.6% |
| Standard Deviation (Sample) | 18.5% | 12.4% |
| Standard Deviation (Population) | 18.3% | 12.2% |
Demographics Similar to Immigrants from the Azores and Immigrants from Zaire by In Labor Force | Age 16-19
In terms of in labor force | age 16-19, the demographic groups most similar to Immigrants from the Azores are Immigrants from Congo (41.7%, a difference of 0.080%), Yugoslavian (41.8%, a difference of 0.14%), Immigrants from Bosnia and Herzegovina (41.8%, a difference of 0.16%), Liberian (41.8%, a difference of 0.24%), and Sioux (41.5%, a difference of 0.42%). Similarly, the demographic groups most similar to Immigrants from Zaire are Immigrants from Laos (40.6%, a difference of 0.090%), Indonesian (40.7%, a difference of 0.10%), Cree (40.8%, a difference of 0.26%), Icelander (40.8%, a difference of 0.28%), and Carpatho Rusyn (40.8%, a difference of 0.33%).
| Demographics | Rating | Rank | In Labor Force | Age 16-19 |
| Liberians | 100.0 /100 | #33 | Exceptional 41.8% |
| Immigrants | Bosnia and Herzegovina | 100.0 /100 | #34 | Exceptional 41.8% |
| Yugoslavians | 100.0 /100 | #35 | Exceptional 41.8% |
| Immigrants | Azores | 100.0 /100 | #36 | Exceptional 41.7% |
| Immigrants | Congo | 100.0 /100 | #37 | Exceptional 41.7% |
| Sioux | 100.0 /100 | #38 | Exceptional 41.5% |
| Scotch-Irish | 100.0 /100 | #39 | Exceptional 41.5% |
| Immigrants | Liberia | 100.0 /100 | #40 | Exceptional 41.5% |
| Celtics | 100.0 /100 | #41 | Exceptional 41.3% |
| Whites/Caucasians | 100.0 /100 | #42 | Exceptional 41.3% |
| Tongans | 100.0 /100 | #43 | Exceptional 41.2% |
| Europeans | 100.0 /100 | #44 | Exceptional 41.1% |
| Croatians | 100.0 /100 | #45 | Exceptional 41.1% |
| Immigrants | Sudan | 100.0 /100 | #46 | Exceptional 41.0% |
| Carpatho Rusyns | 100.0 /100 | #47 | Exceptional 40.8% |
| Icelanders | 100.0 /100 | #48 | Exceptional 40.8% |
| Cree | 100.0 /100 | #49 | Exceptional 40.8% |
| Indonesians | 100.0 /100 | #50 | Exceptional 40.7% |
| Immigrants | Zaire | 100.0 /100 | #51 | Exceptional 40.7% |
| Immigrants | Laos | 100.0 /100 | #52 | Exceptional 40.6% |
| Immigrants | Kenya | 100.0 /100 | #53 | Exceptional 40.5% |