Immigrants from the Azores vs Shoshone In Labor Force | Age 16-19
COMPARE
Immigrants from the Azores
Shoshone
In Labor Force | Age 16-19
In Labor Force | Age 16-19 Comparison
Immigrants from the Azores
Shoshone
41.7%
IN LABOR FORCE | AGE 16-19
100.0/ 100
METRIC RATING
36th/ 347
METRIC RANK
39.3%
IN LABOR FORCE | AGE 16-19
99.7/ 100
METRIC RATING
81st/ 347
METRIC RANK
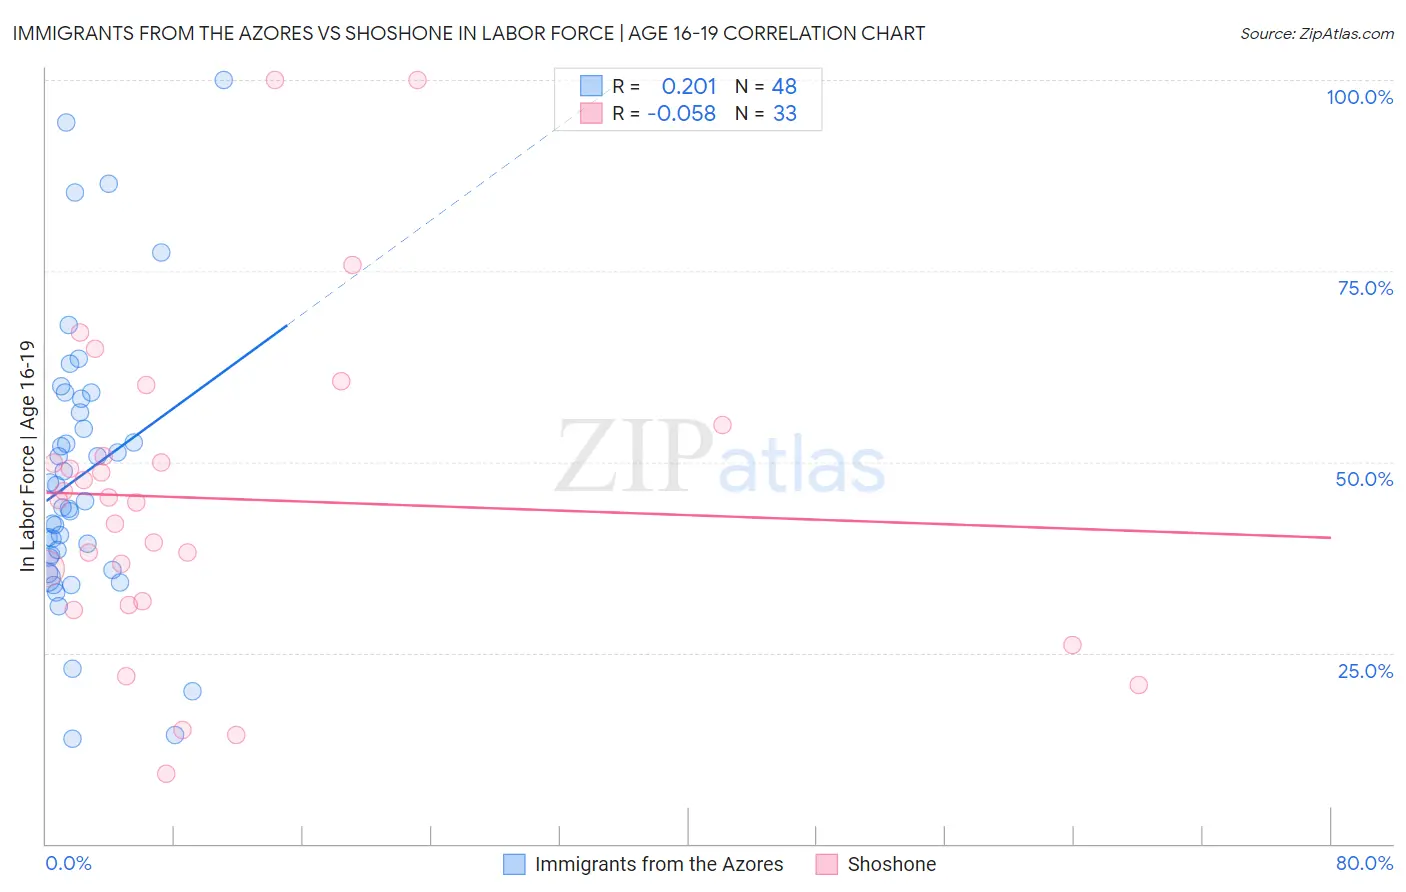
Immigrants from the Azores vs Shoshone In Labor Force | Age 16-19 Correlation Chart
The statistical analysis conducted on geographies consisting of 46,224,998 people shows a weak positive correlation between the proportion of Immigrants from the Azores and labor force participation rate among population between the ages 16 and 19 in the United States with a correlation coefficient (R) of 0.201 and weighted average of 41.7%. Similarly, the statistical analysis conducted on geographies consisting of 66,564,469 people shows a slight negative correlation between the proportion of Shoshone and labor force participation rate among population between the ages 16 and 19 in the United States with a correlation coefficient (R) of -0.058 and weighted average of 39.3%, a difference of 6.2%.
In Labor Force | Age 16-19 Correlation Summary
| Measurement | Immigrants from the Azores | Shoshone |
| Minimum | 13.8% | 9.1% |
| Maximum | 100.0% | 100.0% |
| Range | 86.2% | 90.9% |
| Mean | 48.2% | 45.2% |
| Median | 44.4% | 45.1% |
| Interquartile 25% (IQ1) | 36.7% | 31.5% |
| Interquartile 75% (IQ3) | 57.4% | 52.7% |
| Interquartile Range (IQR) | 20.7% | 21.2% |
| Standard Deviation (Sample) | 18.5% | 20.9% |
| Standard Deviation (Population) | 18.3% | 20.6% |
Similar Demographics by In Labor Force | Age 16-19
Demographics Similar to Immigrants from the Azores by In Labor Force | Age 16-19
In terms of in labor force | age 16-19, the demographic groups most similar to Immigrants from the Azores are Immigrants from Congo (41.7%, a difference of 0.080%), Yugoslavian (41.8%, a difference of 0.14%), Immigrants from Bosnia and Herzegovina (41.8%, a difference of 0.16%), Liberian (41.8%, a difference of 0.24%), and Czechoslovakian (41.9%, a difference of 0.38%).
| Demographics | Rating | Rank | In Labor Force | Age 16-19 |
| French | 100.0 /100 | #29 | Exceptional 42.1% |
| Scottish | 100.0 /100 | #30 | Exceptional 42.0% |
| Irish | 100.0 /100 | #31 | Exceptional 42.0% |
| Czechoslovakians | 100.0 /100 | #32 | Exceptional 41.9% |
| Liberians | 100.0 /100 | #33 | Exceptional 41.8% |
| Immigrants | Bosnia and Herzegovina | 100.0 /100 | #34 | Exceptional 41.8% |
| Yugoslavians | 100.0 /100 | #35 | Exceptional 41.8% |
| Immigrants | Azores | 100.0 /100 | #36 | Exceptional 41.7% |
| Immigrants | Congo | 100.0 /100 | #37 | Exceptional 41.7% |
| Sioux | 100.0 /100 | #38 | Exceptional 41.5% |
| Scotch-Irish | 100.0 /100 | #39 | Exceptional 41.5% |
| Immigrants | Liberia | 100.0 /100 | #40 | Exceptional 41.5% |
| Celtics | 100.0 /100 | #41 | Exceptional 41.3% |
| Whites/Caucasians | 100.0 /100 | #42 | Exceptional 41.3% |
| Tongans | 100.0 /100 | #43 | Exceptional 41.2% |
Demographics Similar to Shoshone by In Labor Force | Age 16-19
In terms of in labor force | age 16-19, the demographic groups most similar to Shoshone are Basque (39.3%, a difference of 0.060%), Spanish (39.3%, a difference of 0.080%), Immigrants from Uganda (39.2%, a difference of 0.21%), Immigrants from Iraq (39.4%, a difference of 0.28%), and Creek (39.1%, a difference of 0.36%).
| Demographics | Rating | Rank | In Labor Force | Age 16-19 |
| Hungarians | 99.9 /100 | #74 | Exceptional 39.8% |
| French American Indians | 99.9 /100 | #75 | Exceptional 39.8% |
| Malaysians | 99.9 /100 | #76 | Exceptional 39.7% |
| Immigrants | Portugal | 99.9 /100 | #77 | Exceptional 39.7% |
| Austrians | 99.8 /100 | #78 | Exceptional 39.5% |
| Marshallese | 99.8 /100 | #79 | Exceptional 39.5% |
| Immigrants | Iraq | 99.8 /100 | #80 | Exceptional 39.4% |
| Shoshone | 99.7 /100 | #81 | Exceptional 39.3% |
| Basques | 99.7 /100 | #82 | Exceptional 39.3% |
| Spanish | 99.7 /100 | #83 | Exceptional 39.3% |
| Immigrants | Uganda | 99.7 /100 | #84 | Exceptional 39.2% |
| Creek | 99.6 /100 | #85 | Exceptional 39.1% |
| Samoans | 99.6 /100 | #86 | Exceptional 39.1% |
| Immigrants | Germany | 99.6 /100 | #87 | Exceptional 39.1% |
| Puget Sound Salish | 99.6 /100 | #88 | Exceptional 39.1% |