Paiute vs Immigrants from Zaire In Labor Force | Age 16-19
COMPARE
Paiute
Immigrants from Zaire
In Labor Force | Age 16-19
In Labor Force | Age 16-19 Comparison
Paiute
Immigrants from Zaire
37.5%
IN LABOR FORCE | AGE 16-19
89.3/ 100
METRIC RATING
145th/ 347
METRIC RANK
40.7%
IN LABOR FORCE | AGE 16-19
100.0/ 100
METRIC RATING
51st/ 347
METRIC RANK
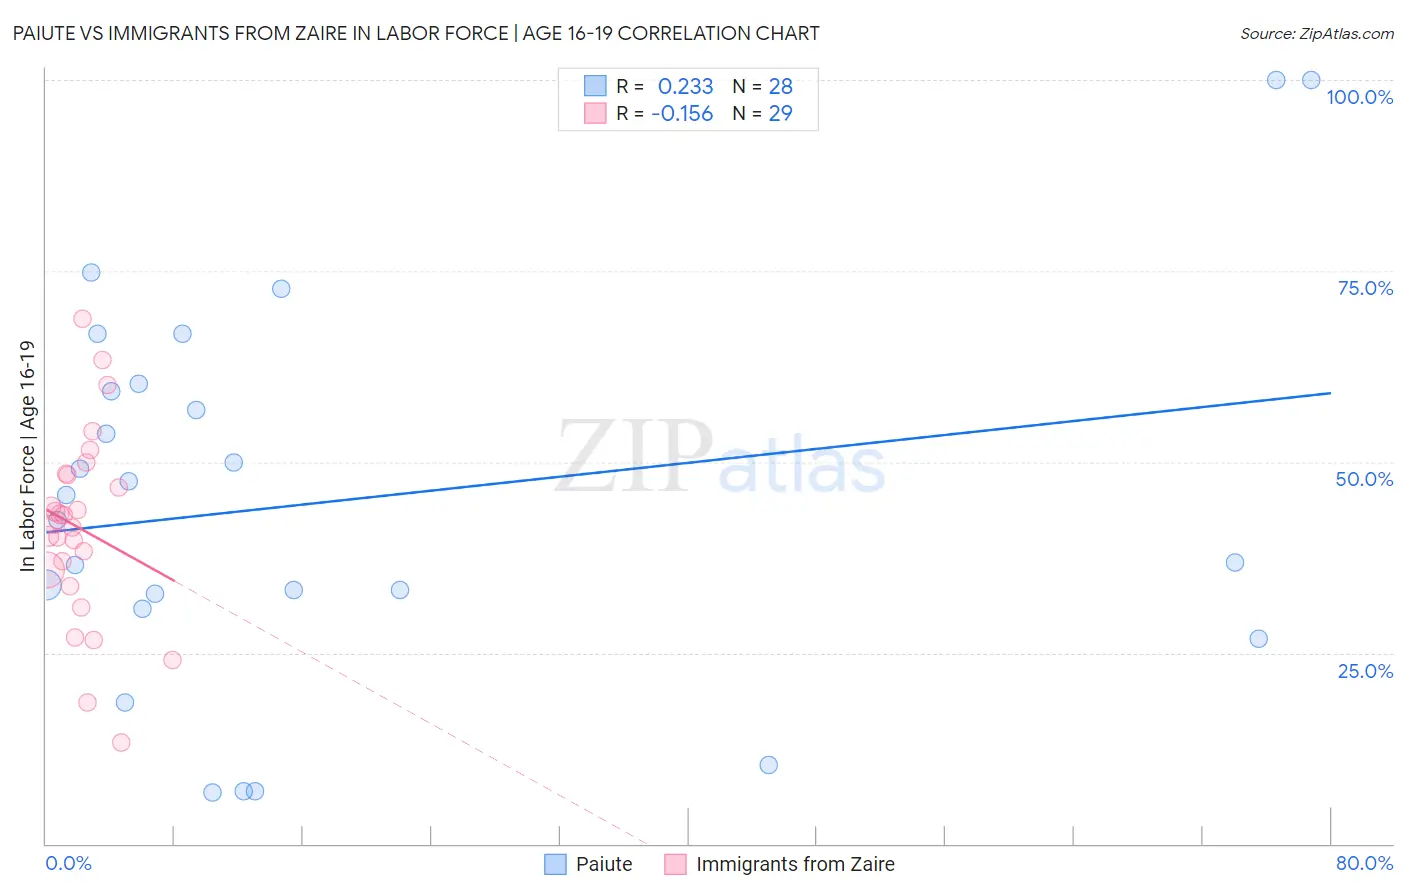
Paiute vs Immigrants from Zaire In Labor Force | Age 16-19 Correlation Chart
The statistical analysis conducted on geographies consisting of 58,354,197 people shows a weak positive correlation between the proportion of Paiute and labor force participation rate among population between the ages 16 and 19 in the United States with a correlation coefficient (R) of 0.233 and weighted average of 37.5%. Similarly, the statistical analysis conducted on geographies consisting of 107,243,431 people shows a poor negative correlation between the proportion of Immigrants from Zaire and labor force participation rate among population between the ages 16 and 19 in the United States with a correlation coefficient (R) of -0.156 and weighted average of 40.7%, a difference of 8.3%.
In Labor Force | Age 16-19 Correlation Summary
| Measurement | Paiute | Immigrants from Zaire |
| Minimum | 6.7% | 13.3% |
| Maximum | 100.0% | 68.8% |
| Range | 93.3% | 55.5% |
| Mean | 45.0% | 41.3% |
| Median | 44.1% | 41.8% |
| Interquartile 25% (IQ1) | 31.7% | 34.8% |
| Interquartile 75% (IQ3) | 59.8% | 48.3% |
| Interquartile Range (IQR) | 28.1% | 13.6% |
| Standard Deviation (Sample) | 25.0% | 12.4% |
| Standard Deviation (Population) | 24.5% | 12.2% |
Similar Demographics by In Labor Force | Age 16-19
Demographics Similar to Paiute by In Labor Force | Age 16-19
In terms of in labor force | age 16-19, the demographic groups most similar to Paiute are Japanese (37.5%, a difference of 0.0%), Pakistani (37.6%, a difference of 0.020%), Sierra Leonean (37.6%, a difference of 0.050%), Immigrants from Western Europe (37.5%, a difference of 0.050%), and Brazilian (37.5%, a difference of 0.080%).
| Demographics | Rating | Rank | In Labor Force | Age 16-19 |
| Comanche | 91.9 /100 | #138 | Exceptional 37.7% |
| Immigrants | Moldova | 91.9 /100 | #139 | Exceptional 37.7% |
| Estonians | 91.7 /100 | #140 | Exceptional 37.7% |
| Syrians | 90.7 /100 | #141 | Exceptional 37.6% |
| Sierra Leoneans | 89.7 /100 | #142 | Excellent 37.6% |
| Pakistanis | 89.5 /100 | #143 | Excellent 37.6% |
| Japanese | 89.3 /100 | #144 | Excellent 37.5% |
| Paiute | 89.3 /100 | #145 | Excellent 37.5% |
| Immigrants | Western Europe | 88.9 /100 | #146 | Excellent 37.5% |
| Brazilians | 88.7 /100 | #147 | Excellent 37.5% |
| Romanians | 87.3 /100 | #148 | Excellent 37.5% |
| Native Hawaiians | 85.0 /100 | #149 | Excellent 37.4% |
| Tsimshian | 84.7 /100 | #150 | Excellent 37.4% |
| Immigrants | Poland | 84.4 /100 | #151 | Excellent 37.3% |
| Immigrants | Sierra Leone | 83.6 /100 | #152 | Excellent 37.3% |
Demographics Similar to Immigrants from Zaire by In Labor Force | Age 16-19
In terms of in labor force | age 16-19, the demographic groups most similar to Immigrants from Zaire are Immigrants from Laos (40.6%, a difference of 0.090%), Indonesian (40.7%, a difference of 0.10%), Cree (40.8%, a difference of 0.26%), Icelander (40.8%, a difference of 0.28%), and Carpatho Rusyn (40.8%, a difference of 0.33%).
| Demographics | Rating | Rank | In Labor Force | Age 16-19 |
| Europeans | 100.0 /100 | #44 | Exceptional 41.1% |
| Croatians | 100.0 /100 | #45 | Exceptional 41.1% |
| Immigrants | Sudan | 100.0 /100 | #46 | Exceptional 41.0% |
| Carpatho Rusyns | 100.0 /100 | #47 | Exceptional 40.8% |
| Icelanders | 100.0 /100 | #48 | Exceptional 40.8% |
| Cree | 100.0 /100 | #49 | Exceptional 40.8% |
| Indonesians | 100.0 /100 | #50 | Exceptional 40.7% |
| Immigrants | Zaire | 100.0 /100 | #51 | Exceptional 40.7% |
| Immigrants | Laos | 100.0 /100 | #52 | Exceptional 40.6% |
| Immigrants | Kenya | 100.0 /100 | #53 | Exceptional 40.5% |
| Tlingit-Haida | 100.0 /100 | #54 | Exceptional 40.5% |
| British | 100.0 /100 | #55 | Exceptional 40.5% |
| Fijians | 100.0 /100 | #56 | Exceptional 40.4% |
| Lithuanians | 100.0 /100 | #57 | Exceptional 40.4% |
| Aleuts | 100.0 /100 | #58 | Exceptional 40.4% |