Immigrants from Grenada vs Immigrants from Zaire In Labor Force | Age 16-19
COMPARE
Immigrants from Grenada
Immigrants from Zaire
In Labor Force | Age 16-19
In Labor Force | Age 16-19 Comparison
Immigrants from Grenada
Immigrants from Zaire
25.4%
IN LABOR FORCE | AGE 16-19
0.0/ 100
METRIC RATING
347th/ 347
METRIC RANK
40.7%
IN LABOR FORCE | AGE 16-19
100.0/ 100
METRIC RATING
51st/ 347
METRIC RANK
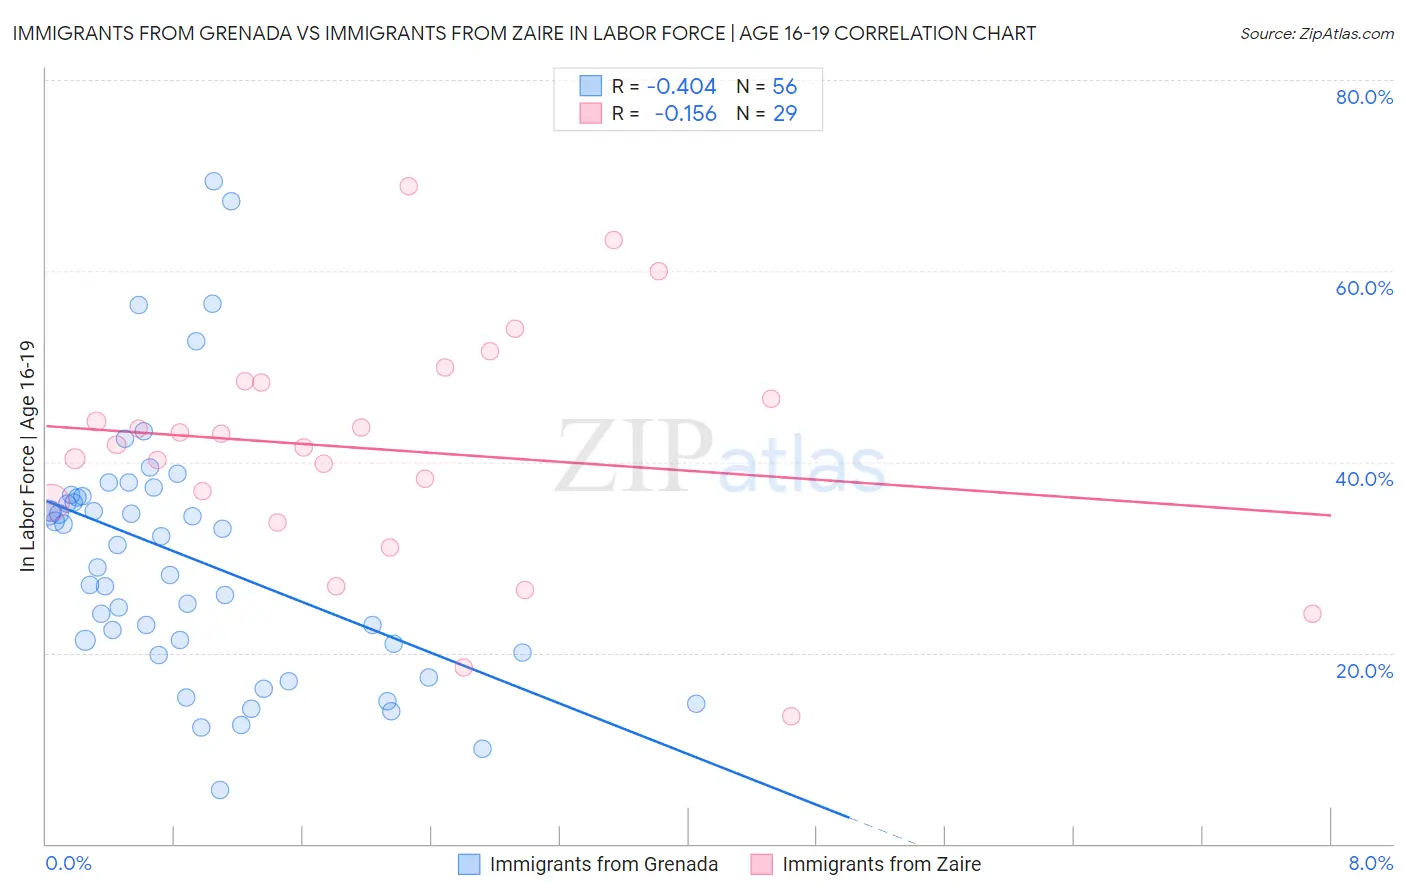
Immigrants from Grenada vs Immigrants from Zaire In Labor Force | Age 16-19 Correlation Chart
The statistical analysis conducted on geographies consisting of 67,191,515 people shows a moderate negative correlation between the proportion of Immigrants from Grenada and labor force participation rate among population between the ages 16 and 19 in the United States with a correlation coefficient (R) of -0.404 and weighted average of 25.4%. Similarly, the statistical analysis conducted on geographies consisting of 107,243,431 people shows a poor negative correlation between the proportion of Immigrants from Zaire and labor force participation rate among population between the ages 16 and 19 in the United States with a correlation coefficient (R) of -0.156 and weighted average of 40.7%, a difference of 60.2%.
In Labor Force | Age 16-19 Correlation Summary
| Measurement | Immigrants from Grenada | Immigrants from Zaire |
| Minimum | 5.6% | 13.3% |
| Maximum | 69.4% | 68.8% |
| Range | 63.8% | 55.5% |
| Mean | 30.0% | 41.3% |
| Median | 30.1% | 41.8% |
| Interquartile 25% (IQ1) | 20.4% | 34.8% |
| Interquartile 75% (IQ3) | 36.3% | 48.3% |
| Interquartile Range (IQR) | 15.9% | 13.6% |
| Standard Deviation (Sample) | 13.4% | 12.4% |
| Standard Deviation (Population) | 13.3% | 12.2% |
Similar Demographics by In Labor Force | Age 16-19
Demographics Similar to Immigrants from Grenada by In Labor Force | Age 16-19
In terms of in labor force | age 16-19, the demographic groups most similar to Immigrants from Grenada are Immigrants from St. Vincent and the Grenadines (26.3%, a difference of 3.4%), Immigrants from Guyana (27.3%, a difference of 7.4%), Guyanese (27.4%, a difference of 8.1%), Yuman (27.7%, a difference of 8.9%), and Immigrants from Barbados (29.0%, a difference of 14.2%).
| Demographics | Rating | Rank | In Labor Force | Age 16-19 |
| Immigrants | Hong Kong | 0.0 /100 | #333 | Tragic 30.5% |
| Puerto Ricans | 0.0 /100 | #334 | Tragic 30.3% |
| Immigrants | Cuba | 0.0 /100 | #335 | Tragic 30.2% |
| Immigrants | Trinidad and Tobago | 0.0 /100 | #336 | Tragic 30.2% |
| Immigrants | Bangladesh | 0.0 /100 | #337 | Tragic 30.0% |
| Vietnamese | 0.0 /100 | #338 | Tragic 29.6% |
| Immigrants | Uzbekistan | 0.0 /100 | #339 | Tragic 29.2% |
| British West Indians | 0.0 /100 | #340 | Tragic 29.1% |
| Immigrants | Armenia | 0.0 /100 | #341 | Tragic 29.0% |
| Immigrants | Barbados | 0.0 /100 | #342 | Tragic 29.0% |
| Yuman | 0.0 /100 | #343 | Tragic 27.7% |
| Guyanese | 0.0 /100 | #344 | Tragic 27.4% |
| Immigrants | Guyana | 0.0 /100 | #345 | Tragic 27.3% |
| Immigrants | St. Vincent and the Grenadines | 0.0 /100 | #346 | Tragic 26.3% |
| Immigrants | Grenada | 0.0 /100 | #347 | Tragic 25.4% |
Demographics Similar to Immigrants from Zaire by In Labor Force | Age 16-19
In terms of in labor force | age 16-19, the demographic groups most similar to Immigrants from Zaire are Immigrants from Laos (40.6%, a difference of 0.090%), Indonesian (40.7%, a difference of 0.10%), Cree (40.8%, a difference of 0.26%), Icelander (40.8%, a difference of 0.28%), and Carpatho Rusyn (40.8%, a difference of 0.33%).
| Demographics | Rating | Rank | In Labor Force | Age 16-19 |
| Europeans | 100.0 /100 | #44 | Exceptional 41.1% |
| Croatians | 100.0 /100 | #45 | Exceptional 41.1% |
| Immigrants | Sudan | 100.0 /100 | #46 | Exceptional 41.0% |
| Carpatho Rusyns | 100.0 /100 | #47 | Exceptional 40.8% |
| Icelanders | 100.0 /100 | #48 | Exceptional 40.8% |
| Cree | 100.0 /100 | #49 | Exceptional 40.8% |
| Indonesians | 100.0 /100 | #50 | Exceptional 40.7% |
| Immigrants | Zaire | 100.0 /100 | #51 | Exceptional 40.7% |
| Immigrants | Laos | 100.0 /100 | #52 | Exceptional 40.6% |
| Immigrants | Kenya | 100.0 /100 | #53 | Exceptional 40.5% |
| Tlingit-Haida | 100.0 /100 | #54 | Exceptional 40.5% |
| British | 100.0 /100 | #55 | Exceptional 40.5% |
| Fijians | 100.0 /100 | #56 | Exceptional 40.4% |
| Lithuanians | 100.0 /100 | #57 | Exceptional 40.4% |
| Aleuts | 100.0 /100 | #58 | Exceptional 40.4% |