Immigrants from Lithuania vs Afghan In Labor Force | Age 20-64
COMPARE
Immigrants from Lithuania
Afghan
In Labor Force | Age 20-64
In Labor Force | Age 20-64 Comparison
Immigrants from Lithuania
Afghans
80.7%
IN LABOR FORCE | AGE 20-64
99.9/ 100
METRIC RATING
31st/ 347
METRIC RANK
80.3%
IN LABOR FORCE | AGE 20-64
98.9/ 100
METRIC RATING
57th/ 347
METRIC RANK
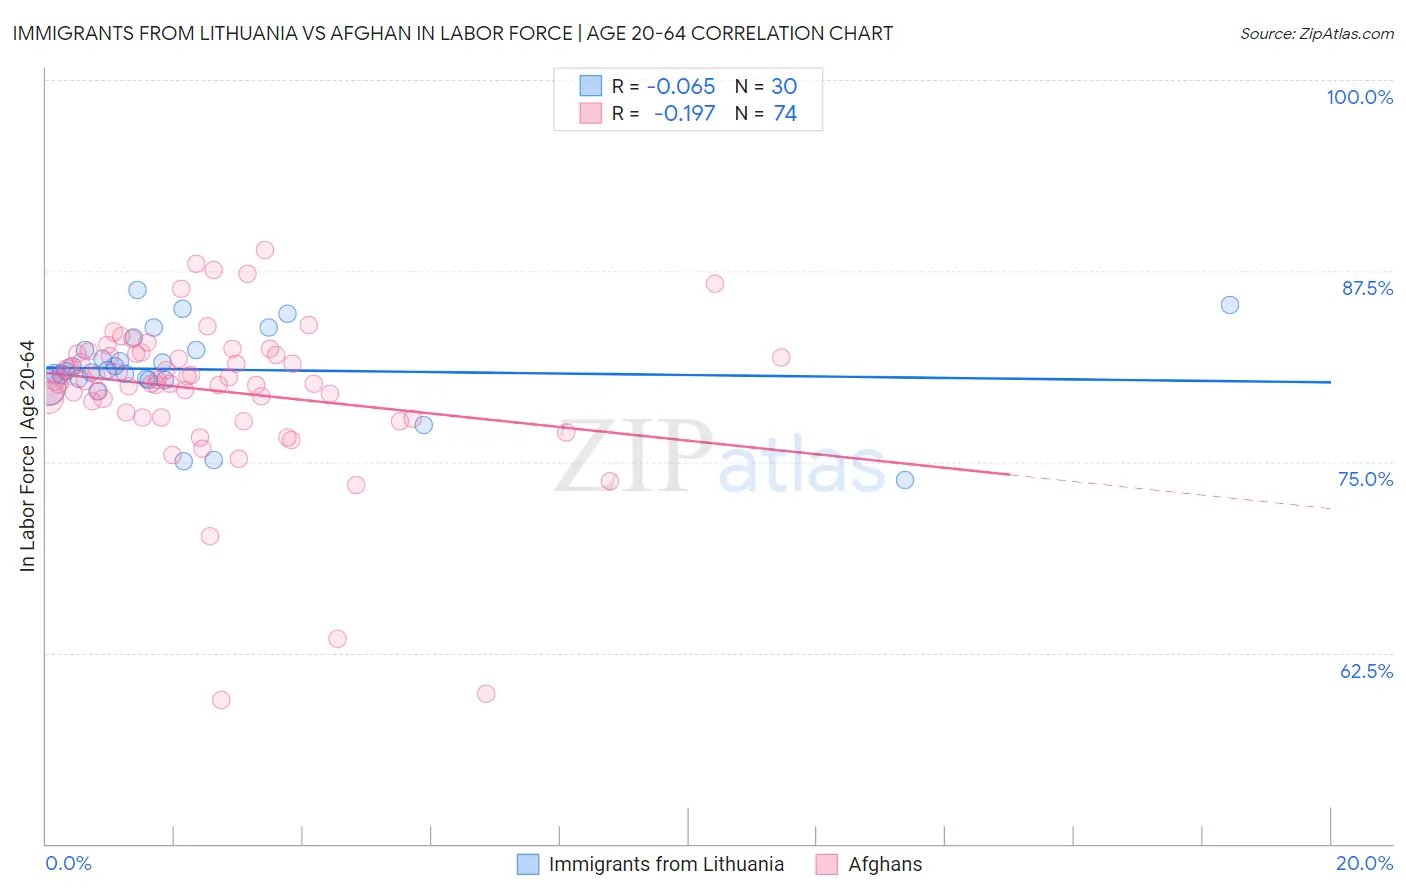
Immigrants from Lithuania vs Afghan In Labor Force | Age 20-64 Correlation Chart
The statistical analysis conducted on geographies consisting of 117,724,932 people shows a slight negative correlation between the proportion of Immigrants from Lithuania and labor force participation rate among population between the ages 20 and 64 in the United States with a correlation coefficient (R) of -0.065 and weighted average of 80.7%. Similarly, the statistical analysis conducted on geographies consisting of 148,874,971 people shows a poor negative correlation between the proportion of Afghans and labor force participation rate among population between the ages 20 and 64 in the United States with a correlation coefficient (R) of -0.197 and weighted average of 80.3%, a difference of 0.53%.
In Labor Force | Age 20-64 Correlation Summary
| Measurement | Immigrants from Lithuania | Afghan |
| Minimum | 73.8% | 59.4% |
| Maximum | 86.3% | 88.9% |
| Range | 12.5% | 29.5% |
| Mean | 81.1% | 79.7% |
| Median | 81.0% | 80.3% |
| Interquartile 25% (IQ1) | 80.4% | 78.3% |
| Interquartile 75% (IQ3) | 82.3% | 82.1% |
| Interquartile Range (IQR) | 2.0% | 3.8% |
| Standard Deviation (Sample) | 2.9% | 5.1% |
| Standard Deviation (Population) | 2.8% | 5.1% |
Similar Demographics by In Labor Force | Age 20-64
Demographics Similar to Immigrants from Lithuania by In Labor Force | Age 20-64
In terms of in labor force | age 20-64, the demographic groups most similar to Immigrants from Lithuania are Immigrants from Ireland (80.7%, a difference of 0.010%), Immigrants from South Central Asia (80.7%, a difference of 0.020%), Immigrants from North Macedonia (80.7%, a difference of 0.020%), Immigrants from Uganda (80.7%, a difference of 0.040%), and Chinese (80.7%, a difference of 0.040%).
| Demographics | Rating | Rank | In Labor Force | Age 20-64 |
| Immigrants | Morocco | 100.0 /100 | #24 | Exceptional 80.8% |
| Kenyans | 100.0 /100 | #25 | Exceptional 80.8% |
| Immigrants | Serbia | 100.0 /100 | #26 | Exceptional 80.8% |
| Immigrants | Kenya | 99.9 /100 | #27 | Exceptional 80.7% |
| Immigrants | Uganda | 99.9 /100 | #28 | Exceptional 80.7% |
| Immigrants | South Central Asia | 99.9 /100 | #29 | Exceptional 80.7% |
| Immigrants | North Macedonia | 99.9 /100 | #30 | Exceptional 80.7% |
| Immigrants | Lithuania | 99.9 /100 | #31 | Exceptional 80.7% |
| Immigrants | Ireland | 99.9 /100 | #32 | Exceptional 80.7% |
| Chinese | 99.9 /100 | #33 | Exceptional 80.7% |
| Immigrants | Brazil | 99.9 /100 | #34 | Exceptional 80.7% |
| Immigrants | Poland | 99.9 /100 | #35 | Exceptional 80.6% |
| Paraguayans | 99.8 /100 | #36 | Exceptional 80.6% |
| Immigrants | Moldova | 99.8 /100 | #37 | Exceptional 80.6% |
| Ugandans | 99.8 /100 | #38 | Exceptional 80.6% |
Demographics Similar to Afghans by In Labor Force | Age 20-64
In terms of in labor force | age 20-64, the demographic groups most similar to Afghans are Immigrants from Northern Africa (80.3%, a difference of 0.0%), Immigrants from Cabo Verde (80.3%, a difference of 0.010%), Serbian (80.3%, a difference of 0.010%), Swedish (80.3%, a difference of 0.010%), and Tongan (80.3%, a difference of 0.020%).
| Demographics | Rating | Rank | In Labor Force | Age 20-64 |
| Immigrants | Sudan | 99.4 /100 | #50 | Exceptional 80.4% |
| Immigrants | Sri Lanka | 99.3 /100 | #51 | Exceptional 80.4% |
| Turks | 99.2 /100 | #52 | Exceptional 80.3% |
| Immigrants | Peru | 99.2 /100 | #53 | Exceptional 80.3% |
| Peruvians | 99.1 /100 | #54 | Exceptional 80.3% |
| Immigrants | Cabo Verde | 99.0 /100 | #55 | Exceptional 80.3% |
| Immigrants | Northern Africa | 99.0 /100 | #56 | Exceptional 80.3% |
| Afghans | 98.9 /100 | #57 | Exceptional 80.3% |
| Serbians | 98.9 /100 | #58 | Exceptional 80.3% |
| Swedes | 98.9 /100 | #59 | Exceptional 80.3% |
| Tongans | 98.8 /100 | #60 | Exceptional 80.3% |
| Burmese | 98.8 /100 | #61 | Exceptional 80.3% |
| Carpatho Rusyns | 98.8 /100 | #62 | Exceptional 80.3% |
| Immigrants | Korea | 98.8 /100 | #63 | Exceptional 80.3% |
| Immigrants | Albania | 98.7 /100 | #64 | Exceptional 80.3% |