Immigrants from Armenia vs Immigrants from Australia In Labor Force | Age 20-24
COMPARE
Immigrants from Armenia
Immigrants from Australia
In Labor Force | Age 20-24
In Labor Force | Age 20-24 Comparison
Immigrants from Armenia
Immigrants from Australia
71.7%
IN LABOR FORCE | AGE 20-24
0.0/ 100
METRIC RATING
317th/ 347
METRIC RANK
74.6%
IN LABOR FORCE | AGE 20-24
14.7/ 100
METRIC RATING
211th/ 347
METRIC RANK
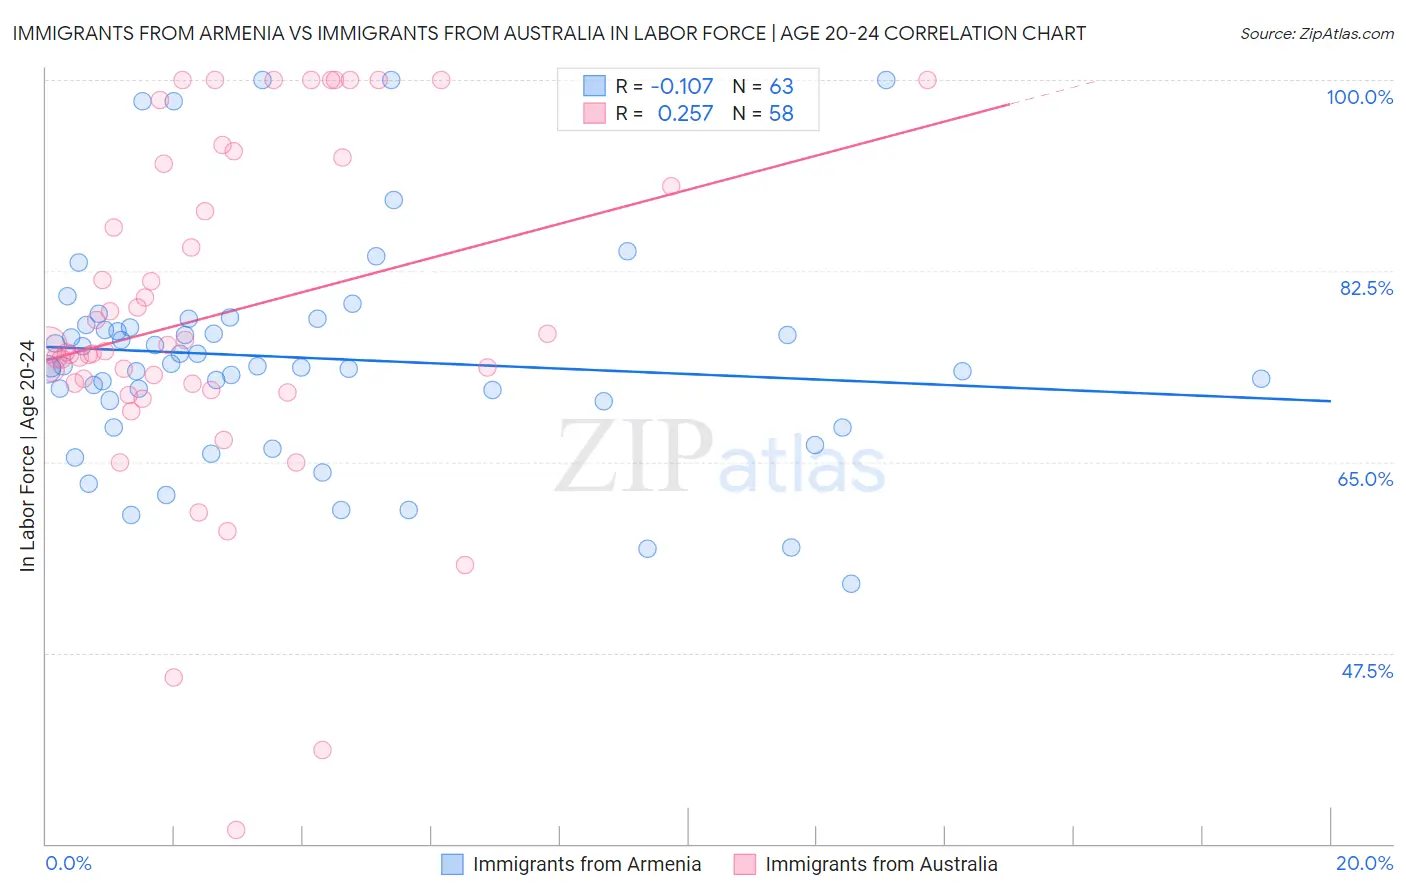
Immigrants from Armenia vs Immigrants from Australia In Labor Force | Age 20-24 Correlation Chart
The statistical analysis conducted on geographies consisting of 97,714,117 people shows a poor negative correlation between the proportion of Immigrants from Armenia and labor force participation rate among population between the ages 20 and 24 in the United States with a correlation coefficient (R) of -0.107 and weighted average of 71.7%. Similarly, the statistical analysis conducted on geographies consisting of 227,133,823 people shows a weak positive correlation between the proportion of Immigrants from Australia and labor force participation rate among population between the ages 20 and 24 in the United States with a correlation coefficient (R) of 0.257 and weighted average of 74.6%, a difference of 4.1%.
In Labor Force | Age 20-24 Correlation Summary
| Measurement | Immigrants from Armenia | Immigrants from Australia |
| Minimum | 53.8% | 31.2% |
| Maximum | 100.0% | 100.0% |
| Range | 46.2% | 68.8% |
| Mean | 74.6% | 78.5% |
| Median | 73.8% | 75.4% |
| Interquartile 25% (IQ1) | 70.5% | 72.2% |
| Interquartile 75% (IQ3) | 77.6% | 92.3% |
| Interquartile Range (IQR) | 7.1% | 20.1% |
| Standard Deviation (Sample) | 10.0% | 15.4% |
| Standard Deviation (Population) | 9.9% | 15.3% |
Similar Demographics by In Labor Force | Age 20-24
Demographics Similar to Immigrants from Armenia by In Labor Force | Age 20-24
In terms of in labor force | age 20-24, the demographic groups most similar to Immigrants from Armenia are Immigrants from Hong Kong (71.6%, a difference of 0.090%), Immigrants from Israel (71.6%, a difference of 0.12%), Immigrants from Eastern Asia (71.8%, a difference of 0.17%), Trinidadian and Tobagonian (71.5%, a difference of 0.20%), and Immigrants from Iran (71.8%, a difference of 0.21%).
| Demographics | Rating | Rank | In Labor Force | Age 20-24 |
| Immigrants | Cuba | 0.0 /100 | #310 | Tragic 72.0% |
| Apache | 0.0 /100 | #311 | Tragic 72.0% |
| Immigrants | Caribbean | 0.0 /100 | #312 | Tragic 71.9% |
| Immigrants | Dominica | 0.0 /100 | #313 | Tragic 71.9% |
| Indians (Asian) | 0.0 /100 | #314 | Tragic 71.9% |
| Immigrants | Iran | 0.0 /100 | #315 | Tragic 71.8% |
| Immigrants | Eastern Asia | 0.0 /100 | #316 | Tragic 71.8% |
| Immigrants | Armenia | 0.0 /100 | #317 | Tragic 71.7% |
| Immigrants | Hong Kong | 0.0 /100 | #318 | Tragic 71.6% |
| Immigrants | Israel | 0.0 /100 | #319 | Tragic 71.6% |
| Trinidadians and Tobagonians | 0.0 /100 | #320 | Tragic 71.5% |
| Immigrants | Taiwan | 0.0 /100 | #321 | Tragic 71.5% |
| Filipinos | 0.0 /100 | #322 | Tragic 71.4% |
| West Indians | 0.0 /100 | #323 | Tragic 71.3% |
| Immigrants | Dominican Republic | 0.0 /100 | #324 | Tragic 71.2% |
Demographics Similar to Immigrants from Australia by In Labor Force | Age 20-24
In terms of in labor force | age 20-24, the demographic groups most similar to Immigrants from Australia are Uruguayan (74.6%, a difference of 0.010%), Immigrants from Uruguay (74.6%, a difference of 0.030%), Arab (74.6%, a difference of 0.030%), Albanian (74.6%, a difference of 0.040%), and Creek (74.5%, a difference of 0.040%).
| Demographics | Rating | Rank | In Labor Force | Age 20-24 |
| Immigrants | Italy | 17.6 /100 | #204 | Poor 74.6% |
| Inupiat | 17.6 /100 | #205 | Poor 74.6% |
| Sioux | 17.5 /100 | #206 | Poor 74.6% |
| Albanians | 16.2 /100 | #207 | Poor 74.6% |
| Immigrants | Uruguay | 15.8 /100 | #208 | Poor 74.6% |
| Arabs | 15.8 /100 | #209 | Poor 74.6% |
| Uruguayans | 15.1 /100 | #210 | Poor 74.6% |
| Immigrants | Australia | 14.7 /100 | #211 | Poor 74.6% |
| Creek | 13.3 /100 | #212 | Poor 74.5% |
| Peruvians | 13.3 /100 | #213 | Poor 74.5% |
| Immigrants | Southern Europe | 13.2 /100 | #214 | Poor 74.5% |
| Immigrants | Ghana | 12.7 /100 | #215 | Poor 74.5% |
| Immigrants | Kuwait | 12.7 /100 | #216 | Poor 74.5% |
| Chileans | 12.5 /100 | #217 | Poor 74.5% |
| Immigrants | Peru | 10.6 /100 | #218 | Poor 74.5% |