Immigrants from Armenia vs Immigrants from Romania In Labor Force | Age 20-24
COMPARE
Immigrants from Armenia
Immigrants from Romania
In Labor Force | Age 20-24
In Labor Force | Age 20-24 Comparison
Immigrants from Armenia
Immigrants from Romania
71.7%
IN LABOR FORCE | AGE 20-24
0.0/ 100
METRIC RATING
317th/ 347
METRIC RANK
75.2%
IN LABOR FORCE | AGE 20-24
64.6/ 100
METRIC RATING
162nd/ 347
METRIC RANK
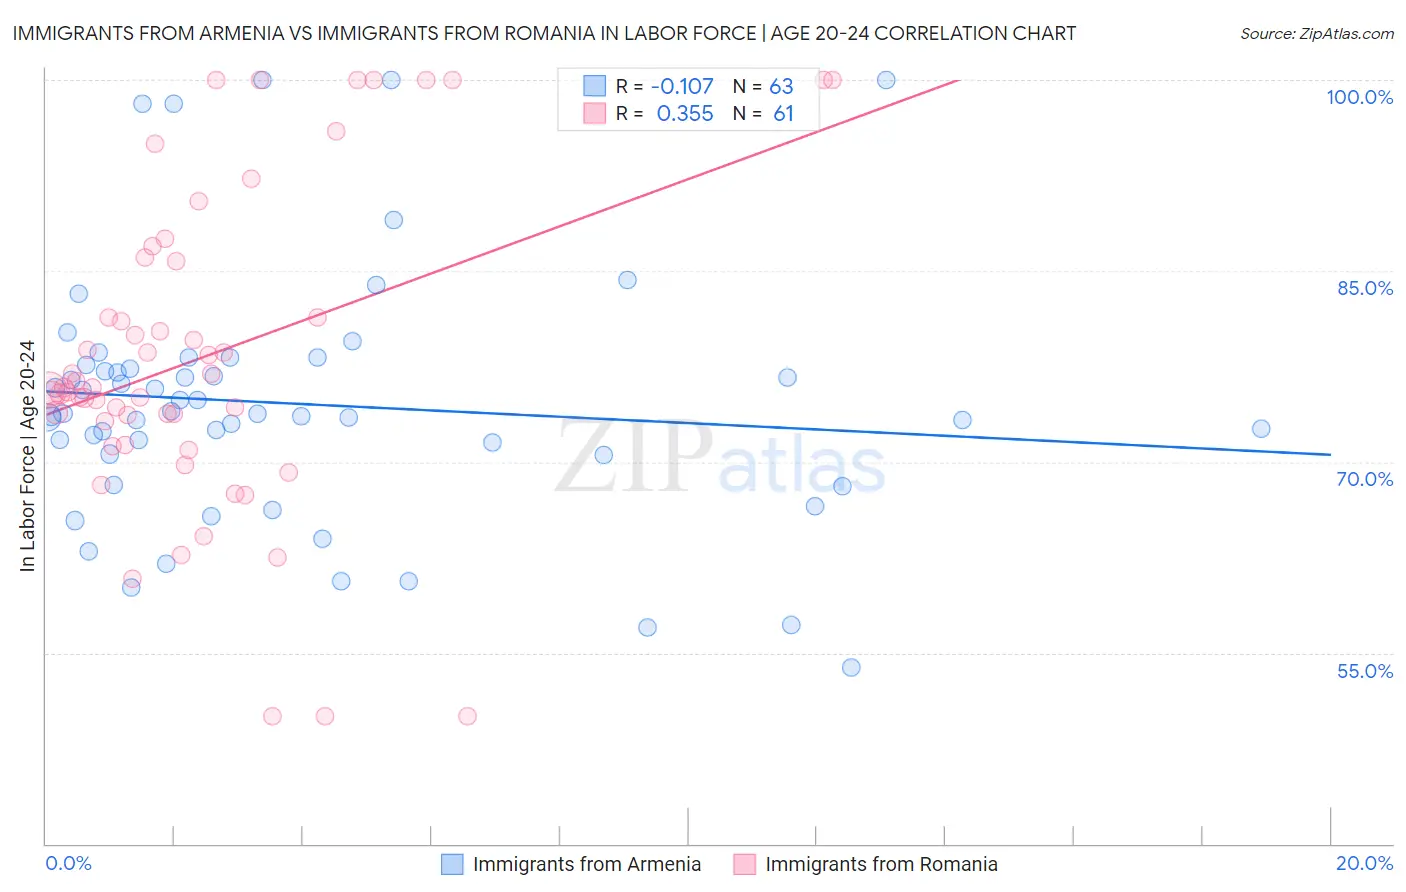
Immigrants from Armenia vs Immigrants from Romania In Labor Force | Age 20-24 Correlation Chart
The statistical analysis conducted on geographies consisting of 97,714,117 people shows a poor negative correlation between the proportion of Immigrants from Armenia and labor force participation rate among population between the ages 20 and 24 in the United States with a correlation coefficient (R) of -0.107 and weighted average of 71.7%. Similarly, the statistical analysis conducted on geographies consisting of 256,948,793 people shows a mild positive correlation between the proportion of Immigrants from Romania and labor force participation rate among population between the ages 20 and 24 in the United States with a correlation coefficient (R) of 0.355 and weighted average of 75.2%, a difference of 5.0%.
In Labor Force | Age 20-24 Correlation Summary
| Measurement | Immigrants from Armenia | Immigrants from Romania |
| Minimum | 53.8% | 50.0% |
| Maximum | 100.0% | 100.0% |
| Range | 46.2% | 50.0% |
| Mean | 74.6% | 78.3% |
| Median | 73.8% | 75.9% |
| Interquartile 25% (IQ1) | 70.5% | 72.2% |
| Interquartile 75% (IQ3) | 77.6% | 85.9% |
| Interquartile Range (IQR) | 7.1% | 13.7% |
| Standard Deviation (Sample) | 10.0% | 12.4% |
| Standard Deviation (Population) | 9.9% | 12.3% |
Similar Demographics by In Labor Force | Age 20-24
Demographics Similar to Immigrants from Armenia by In Labor Force | Age 20-24
In terms of in labor force | age 20-24, the demographic groups most similar to Immigrants from Armenia are Immigrants from Hong Kong (71.6%, a difference of 0.090%), Immigrants from Israel (71.6%, a difference of 0.12%), Immigrants from Eastern Asia (71.8%, a difference of 0.17%), Trinidadian and Tobagonian (71.5%, a difference of 0.20%), and Immigrants from Iran (71.8%, a difference of 0.21%).
| Demographics | Rating | Rank | In Labor Force | Age 20-24 |
| Immigrants | Cuba | 0.0 /100 | #310 | Tragic 72.0% |
| Apache | 0.0 /100 | #311 | Tragic 72.0% |
| Immigrants | Caribbean | 0.0 /100 | #312 | Tragic 71.9% |
| Immigrants | Dominica | 0.0 /100 | #313 | Tragic 71.9% |
| Indians (Asian) | 0.0 /100 | #314 | Tragic 71.9% |
| Immigrants | Iran | 0.0 /100 | #315 | Tragic 71.8% |
| Immigrants | Eastern Asia | 0.0 /100 | #316 | Tragic 71.8% |
| Immigrants | Armenia | 0.0 /100 | #317 | Tragic 71.7% |
| Immigrants | Hong Kong | 0.0 /100 | #318 | Tragic 71.6% |
| Immigrants | Israel | 0.0 /100 | #319 | Tragic 71.6% |
| Trinidadians and Tobagonians | 0.0 /100 | #320 | Tragic 71.5% |
| Immigrants | Taiwan | 0.0 /100 | #321 | Tragic 71.5% |
| Filipinos | 0.0 /100 | #322 | Tragic 71.4% |
| West Indians | 0.0 /100 | #323 | Tragic 71.3% |
| Immigrants | Dominican Republic | 0.0 /100 | #324 | Tragic 71.2% |
Demographics Similar to Immigrants from Romania by In Labor Force | Age 20-24
In terms of in labor force | age 20-24, the demographic groups most similar to Immigrants from Romania are New Zealander (75.2%, a difference of 0.010%), Costa Rican (75.2%, a difference of 0.010%), Bolivian (75.2%, a difference of 0.010%), Afghan (75.2%, a difference of 0.020%), and Cambodian (75.2%, a difference of 0.060%).
| Demographics | Rating | Rank | In Labor Force | Age 20-24 |
| Immigrants | Guatemala | 71.9 /100 | #155 | Good 75.3% |
| Immigrants | El Salvador | 71.7 /100 | #156 | Good 75.3% |
| Immigrants | Western Europe | 71.5 /100 | #157 | Good 75.3% |
| Immigrants | Bolivia | 71.0 /100 | #158 | Good 75.3% |
| South American Indians | 69.0 /100 | #159 | Good 75.3% |
| Japanese | 68.7 /100 | #160 | Good 75.3% |
| New Zealanders | 65.4 /100 | #161 | Good 75.2% |
| Immigrants | Romania | 64.6 /100 | #162 | Good 75.2% |
| Costa Ricans | 64.2 /100 | #163 | Good 75.2% |
| Bolivians | 64.0 /100 | #164 | Good 75.2% |
| Afghans | 63.5 /100 | #165 | Good 75.2% |
| Cambodians | 60.5 /100 | #166 | Good 75.2% |
| Immigrants | South Eastern Asia | 57.5 /100 | #167 | Average 75.1% |
| Immigrants | Western Africa | 56.7 /100 | #168 | Average 75.1% |
| Immigrants | Philippines | 55.8 /100 | #169 | Average 75.1% |