Immigrants from Armenia vs Samoan In Labor Force | Age 20-64
COMPARE
Immigrants from Armenia
Samoan
In Labor Force | Age 20-64
In Labor Force | Age 20-64 Comparison
Immigrants from Armenia
Samoans
79.2%
IN LABOR FORCE | AGE 20-64
12.2/ 100
METRIC RATING
214th/ 347
METRIC RANK
79.0%
IN LABOR FORCE | AGE 20-64
2.9/ 100
METRIC RATING
236th/ 347
METRIC RANK
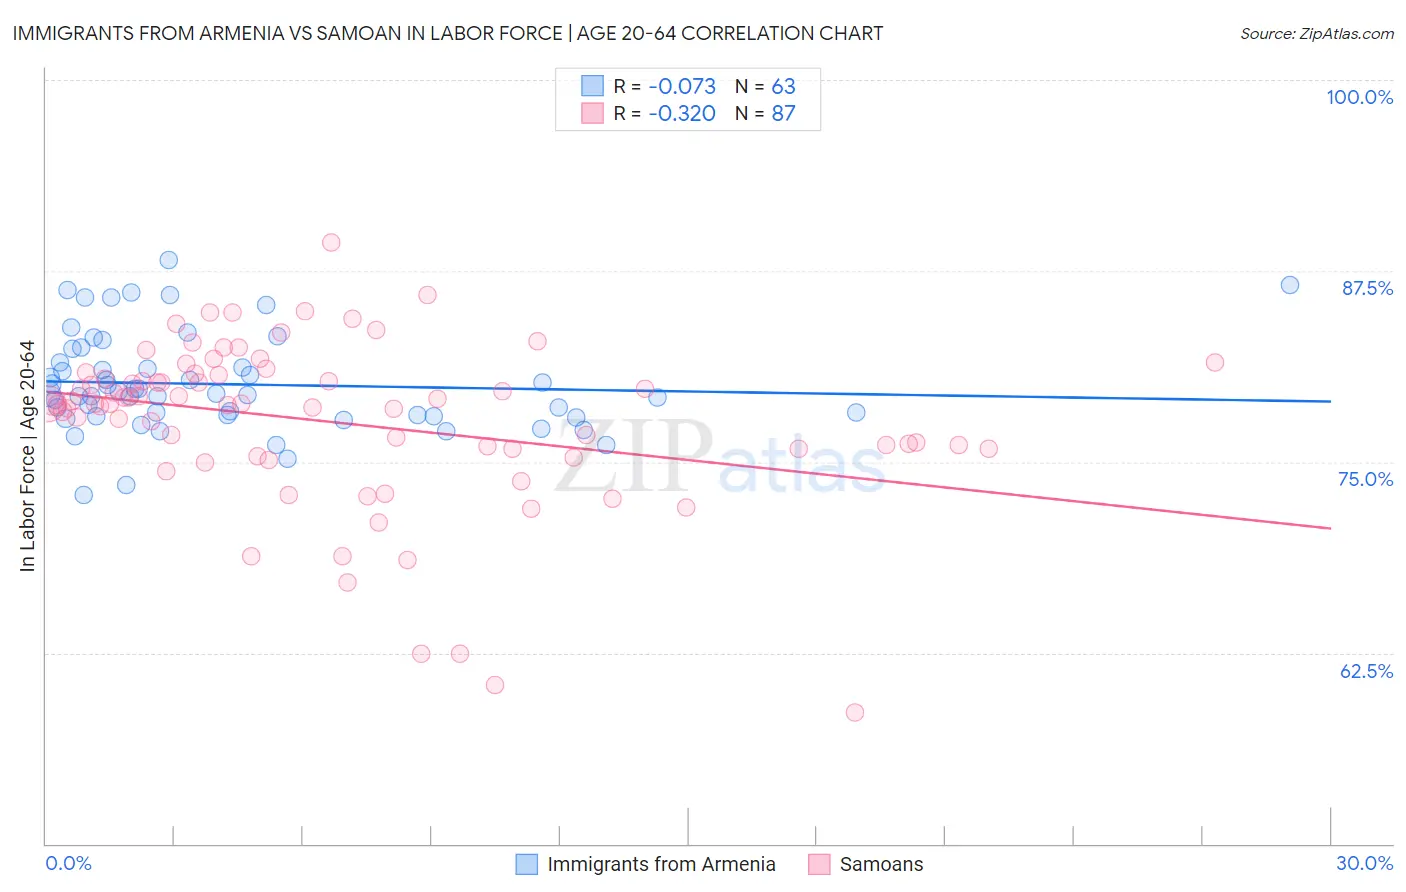
Immigrants from Armenia vs Samoan In Labor Force | Age 20-64 Correlation Chart
The statistical analysis conducted on geographies consisting of 97,718,343 people shows a slight negative correlation between the proportion of Immigrants from Armenia and labor force participation rate among population between the ages 20 and 64 in the United States with a correlation coefficient (R) of -0.073 and weighted average of 79.2%. Similarly, the statistical analysis conducted on geographies consisting of 225,189,054 people shows a mild negative correlation between the proportion of Samoans and labor force participation rate among population between the ages 20 and 64 in the United States with a correlation coefficient (R) of -0.320 and weighted average of 79.0%, a difference of 0.31%.
In Labor Force | Age 20-64 Correlation Summary
| Measurement | Immigrants from Armenia | Samoan |
| Minimum | 72.8% | 58.6% |
| Maximum | 88.2% | 89.4% |
| Range | 15.4% | 30.8% |
| Mean | 80.1% | 77.6% |
| Median | 79.5% | 78.8% |
| Interquartile 25% (IQ1) | 78.0% | 75.9% |
| Interquartile 75% (IQ3) | 81.5% | 80.7% |
| Interquartile Range (IQR) | 3.5% | 4.9% |
| Standard Deviation (Sample) | 3.2% | 5.5% |
| Standard Deviation (Population) | 3.2% | 5.5% |
Similar Demographics by In Labor Force | Age 20-64
Demographics Similar to Immigrants from Armenia by In Labor Force | Age 20-64
In terms of in labor force | age 20-64, the demographic groups most similar to Immigrants from Armenia are Immigrants from Norway (79.2%, a difference of 0.0%), Immigrants from Portugal (79.3%, a difference of 0.010%), Arab (79.2%, a difference of 0.010%), Irish (79.3%, a difference of 0.020%), and Immigrants from Western Asia (79.2%, a difference of 0.020%).
| Demographics | Rating | Rank | In Labor Force | Age 20-64 |
| Sub-Saharan Africans | 16.5 /100 | #207 | Poor 79.3% |
| British | 16.5 /100 | #208 | Poor 79.3% |
| Bangladeshis | 16.4 /100 | #209 | Poor 79.3% |
| Haitians | 16.1 /100 | #210 | Poor 79.3% |
| Europeans | 15.3 /100 | #211 | Poor 79.3% |
| Irish | 13.2 /100 | #212 | Poor 79.3% |
| Immigrants | Portugal | 12.8 /100 | #213 | Poor 79.3% |
| Immigrants | Armenia | 12.2 /100 | #214 | Poor 79.2% |
| Immigrants | Norway | 12.0 /100 | #215 | Poor 79.2% |
| Arabs | 11.4 /100 | #216 | Poor 79.2% |
| Immigrants | Western Asia | 11.0 /100 | #217 | Poor 79.2% |
| Immigrants | England | 9.3 /100 | #218 | Tragic 79.2% |
| French Canadians | 8.4 /100 | #219 | Tragic 79.2% |
| Immigrants | Immigrants | 7.7 /100 | #220 | Tragic 79.2% |
| Hungarians | 7.2 /100 | #221 | Tragic 79.2% |
Demographics Similar to Samoans by In Labor Force | Age 20-64
In terms of in labor force | age 20-64, the demographic groups most similar to Samoans are Immigrants from North America (79.0%, a difference of 0.0%), Immigrants from Canada (79.0%, a difference of 0.020%), Tlingit-Haida (79.0%, a difference of 0.020%), Immigrants from Jamaica (79.0%, a difference of 0.030%), and Welsh (79.0%, a difference of 0.040%).
| Demographics | Rating | Rank | In Labor Force | Age 20-64 |
| Alsatians | 5.7 /100 | #229 | Tragic 79.1% |
| Native Hawaiians | 5.6 /100 | #230 | Tragic 79.1% |
| Lebanese | 5.1 /100 | #231 | Tragic 79.1% |
| Guamanians/Chamorros | 4.5 /100 | #232 | Tragic 79.1% |
| Japanese | 4.0 /100 | #233 | Tragic 79.1% |
| Immigrants | Canada | 3.2 /100 | #234 | Tragic 79.0% |
| Tlingit-Haida | 3.2 /100 | #235 | Tragic 79.0% |
| Samoans | 2.9 /100 | #236 | Tragic 79.0% |
| Immigrants | North America | 2.9 /100 | #237 | Tragic 79.0% |
| Immigrants | Jamaica | 2.6 /100 | #238 | Tragic 79.0% |
| Welsh | 2.4 /100 | #239 | Tragic 79.0% |
| Trinidadians and Tobagonians | 2.3 /100 | #240 | Tragic 79.0% |
| Jamaicans | 2.0 /100 | #241 | Tragic 78.9% |
| Immigrants | Micronesia | 1.9 /100 | #242 | Tragic 78.9% |
| Immigrants | West Indies | 1.7 /100 | #243 | Tragic 78.9% |