Ethiopian vs Samoan In Labor Force | Age 20-64
COMPARE
Ethiopian
Samoan
In Labor Force | Age 20-64
In Labor Force | Age 20-64 Comparison
Ethiopians
Samoans
82.0%
IN LABOR FORCE | AGE 20-64
100.0/ 100
METRIC RATING
2nd/ 347
METRIC RANK
79.0%
IN LABOR FORCE | AGE 20-64
2.9/ 100
METRIC RATING
236th/ 347
METRIC RANK
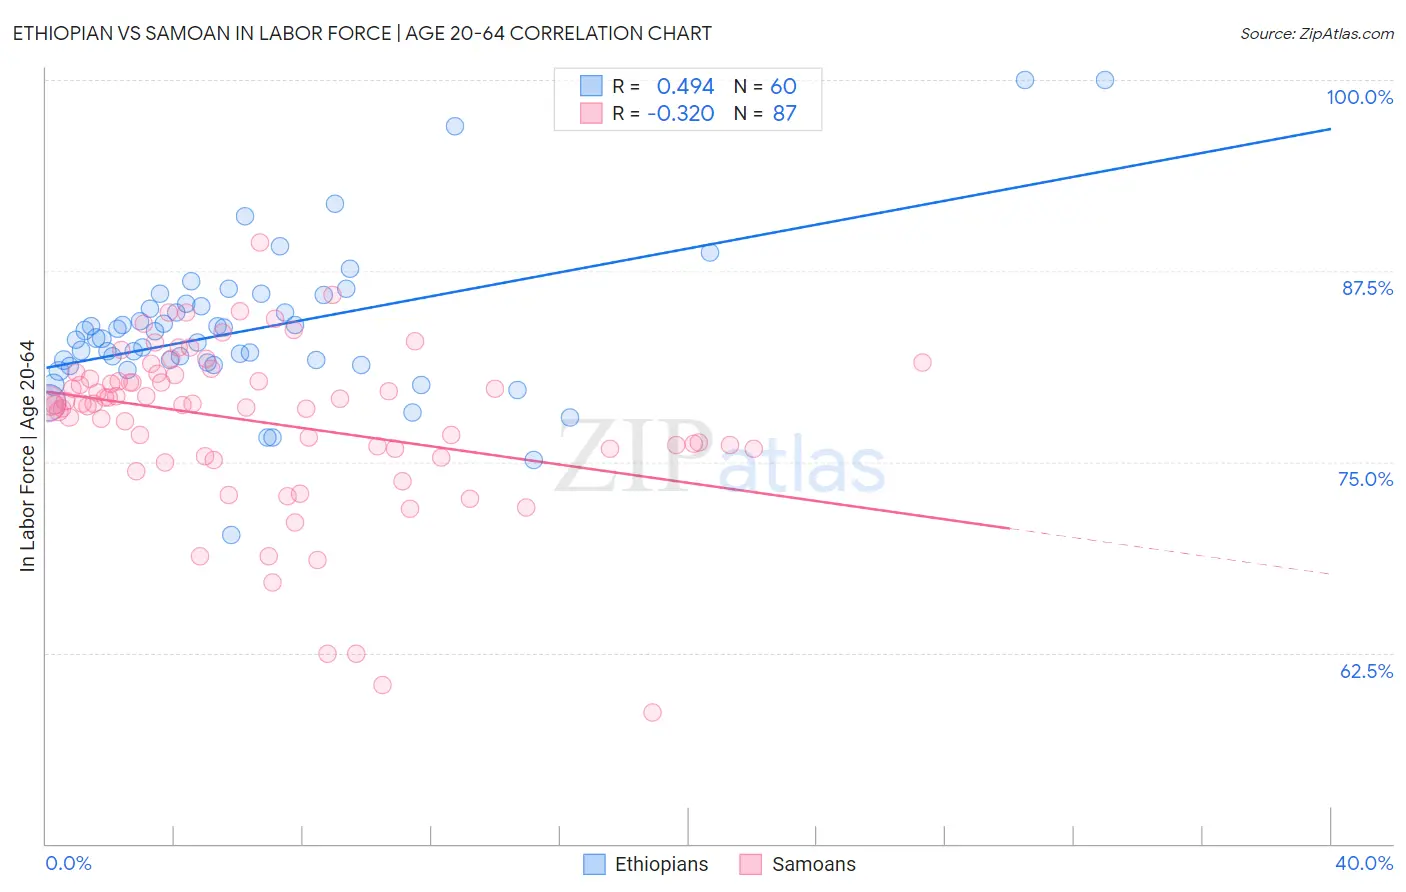
Ethiopian vs Samoan In Labor Force | Age 20-64 Correlation Chart
The statistical analysis conducted on geographies consisting of 223,266,449 people shows a moderate positive correlation between the proportion of Ethiopians and labor force participation rate among population between the ages 20 and 64 in the United States with a correlation coefficient (R) of 0.494 and weighted average of 82.0%. Similarly, the statistical analysis conducted on geographies consisting of 225,189,054 people shows a mild negative correlation between the proportion of Samoans and labor force participation rate among population between the ages 20 and 64 in the United States with a correlation coefficient (R) of -0.320 and weighted average of 79.0%, a difference of 3.7%.
In Labor Force | Age 20-64 Correlation Summary
| Measurement | Ethiopian | Samoan |
| Minimum | 70.2% | 58.6% |
| Maximum | 100.0% | 89.4% |
| Range | 29.8% | 30.8% |
| Mean | 83.7% | 77.6% |
| Median | 83.1% | 78.8% |
| Interquartile 25% (IQ1) | 81.4% | 75.9% |
| Interquartile 75% (IQ3) | 85.3% | 80.7% |
| Interquartile Range (IQR) | 3.9% | 4.9% |
| Standard Deviation (Sample) | 5.1% | 5.5% |
| Standard Deviation (Population) | 5.0% | 5.5% |
Similar Demographics by In Labor Force | Age 20-64
Demographics Similar to Ethiopians by In Labor Force | Age 20-64
In terms of in labor force | age 20-64, the demographic groups most similar to Ethiopians are Immigrants from Bolivia (81.9%, a difference of 0.020%), Immigrants from Ethiopia (82.1%, a difference of 0.12%), Luxembourger (81.9%, a difference of 0.13%), Bolivian (81.7%, a difference of 0.33%), and Somali (81.6%, a difference of 0.44%).
| Demographics | Rating | Rank | In Labor Force | Age 20-64 |
| Immigrants | Ethiopia | 100.0 /100 | #1 | Exceptional 82.1% |
| Ethiopians | 100.0 /100 | #2 | Exceptional 82.0% |
| Immigrants | Bolivia | 100.0 /100 | #3 | Exceptional 81.9% |
| Luxembourgers | 100.0 /100 | #4 | Exceptional 81.9% |
| Bolivians | 100.0 /100 | #5 | Exceptional 81.7% |
| Somalis | 100.0 /100 | #6 | Exceptional 81.6% |
| Immigrants | Cameroon | 100.0 /100 | #7 | Exceptional 81.6% |
| Immigrants | Somalia | 100.0 /100 | #8 | Exceptional 81.6% |
| Sierra Leoneans | 100.0 /100 | #9 | Exceptional 81.5% |
| Immigrants | Sierra Leone | 100.0 /100 | #10 | Exceptional 81.5% |
| Immigrants | Eastern Africa | 100.0 /100 | #11 | Exceptional 81.3% |
| Immigrants | Eritrea | 100.0 /100 | #12 | Exceptional 81.3% |
| Immigrants | India | 100.0 /100 | #13 | Exceptional 81.3% |
| Cambodians | 100.0 /100 | #14 | Exceptional 81.1% |
| Bulgarians | 100.0 /100 | #15 | Exceptional 81.1% |
Demographics Similar to Samoans by In Labor Force | Age 20-64
In terms of in labor force | age 20-64, the demographic groups most similar to Samoans are Immigrants from North America (79.0%, a difference of 0.0%), Immigrants from Canada (79.0%, a difference of 0.020%), Tlingit-Haida (79.0%, a difference of 0.020%), Immigrants from Jamaica (79.0%, a difference of 0.030%), and Welsh (79.0%, a difference of 0.040%).
| Demographics | Rating | Rank | In Labor Force | Age 20-64 |
| Alsatians | 5.7 /100 | #229 | Tragic 79.1% |
| Native Hawaiians | 5.6 /100 | #230 | Tragic 79.1% |
| Lebanese | 5.1 /100 | #231 | Tragic 79.1% |
| Guamanians/Chamorros | 4.5 /100 | #232 | Tragic 79.1% |
| Japanese | 4.0 /100 | #233 | Tragic 79.1% |
| Immigrants | Canada | 3.2 /100 | #234 | Tragic 79.0% |
| Tlingit-Haida | 3.2 /100 | #235 | Tragic 79.0% |
| Samoans | 2.9 /100 | #236 | Tragic 79.0% |
| Immigrants | North America | 2.9 /100 | #237 | Tragic 79.0% |
| Immigrants | Jamaica | 2.6 /100 | #238 | Tragic 79.0% |
| Welsh | 2.4 /100 | #239 | Tragic 79.0% |
| Trinidadians and Tobagonians | 2.3 /100 | #240 | Tragic 79.0% |
| Jamaicans | 2.0 /100 | #241 | Tragic 78.9% |
| Immigrants | Micronesia | 1.9 /100 | #242 | Tragic 78.9% |
| Immigrants | West Indies | 1.7 /100 | #243 | Tragic 78.9% |