Czech vs Samoan In Labor Force | Age 20-64
COMPARE
Czech
Samoan
In Labor Force | Age 20-64
In Labor Force | Age 20-64 Comparison
Czechs
Samoans
80.5%
IN LABOR FORCE | AGE 20-64
99.7/ 100
METRIC RATING
43rd/ 347
METRIC RANK
79.0%
IN LABOR FORCE | AGE 20-64
2.9/ 100
METRIC RATING
236th/ 347
METRIC RANK
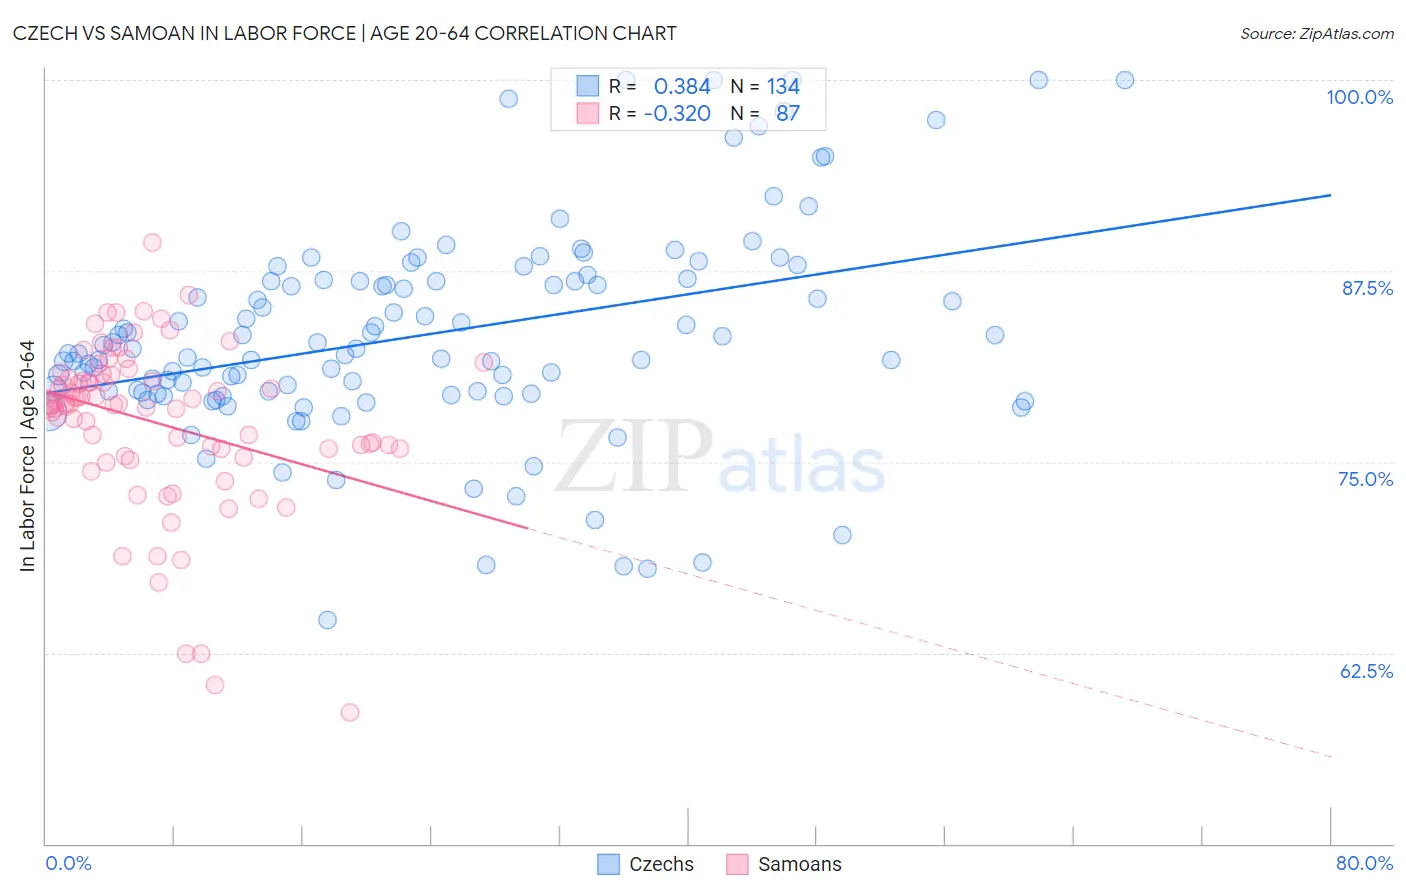
Czech vs Samoan In Labor Force | Age 20-64 Correlation Chart
The statistical analysis conducted on geographies consisting of 484,822,871 people shows a mild positive correlation between the proportion of Czechs and labor force participation rate among population between the ages 20 and 64 in the United States with a correlation coefficient (R) of 0.384 and weighted average of 80.5%. Similarly, the statistical analysis conducted on geographies consisting of 225,189,054 people shows a mild negative correlation between the proportion of Samoans and labor force participation rate among population between the ages 20 and 64 in the United States with a correlation coefficient (R) of -0.320 and weighted average of 79.0%, a difference of 1.9%.
In Labor Force | Age 20-64 Correlation Summary
| Measurement | Czech | Samoan |
| Minimum | 64.6% | 58.6% |
| Maximum | 100.0% | 89.4% |
| Range | 35.4% | 30.8% |
| Mean | 83.3% | 77.6% |
| Median | 82.3% | 78.8% |
| Interquartile 25% (IQ1) | 79.6% | 75.9% |
| Interquartile 75% (IQ3) | 86.8% | 80.7% |
| Interquartile Range (IQR) | 7.3% | 4.9% |
| Standard Deviation (Sample) | 6.9% | 5.5% |
| Standard Deviation (Population) | 6.8% | 5.5% |
Similar Demographics by In Labor Force | Age 20-64
Demographics Similar to Czechs by In Labor Force | Age 20-64
In terms of in labor force | age 20-64, the demographic groups most similar to Czechs are Latvian (80.5%, a difference of 0.010%), Immigrants from Liberia (80.5%, a difference of 0.030%), Immigrants from Middle Africa (80.5%, a difference of 0.030%), Brazilian (80.5%, a difference of 0.040%), and Immigrants from Zimbabwe (80.5%, a difference of 0.040%).
| Demographics | Rating | Rank | In Labor Force | Age 20-64 |
| Paraguayans | 99.8 /100 | #36 | Exceptional 80.6% |
| Immigrants | Moldova | 99.8 /100 | #37 | Exceptional 80.6% |
| Ugandans | 99.8 /100 | #38 | Exceptional 80.6% |
| Brazilians | 99.8 /100 | #39 | Exceptional 80.5% |
| Immigrants | Zimbabwe | 99.8 /100 | #40 | Exceptional 80.5% |
| Immigrants | Liberia | 99.8 /100 | #41 | Exceptional 80.5% |
| Latvians | 99.8 /100 | #42 | Exceptional 80.5% |
| Czechs | 99.7 /100 | #43 | Exceptional 80.5% |
| Immigrants | Middle Africa | 99.7 /100 | #44 | Exceptional 80.5% |
| Slovenes | 99.7 /100 | #45 | Exceptional 80.5% |
| Immigrants | Pakistan | 99.6 /100 | #46 | Exceptional 80.5% |
| Immigrants | Africa | 99.6 /100 | #47 | Exceptional 80.4% |
| Immigrants | Hong Kong | 99.5 /100 | #48 | Exceptional 80.4% |
| Immigrants | Greece | 99.4 /100 | #49 | Exceptional 80.4% |
| Immigrants | Sudan | 99.4 /100 | #50 | Exceptional 80.4% |
Demographics Similar to Samoans by In Labor Force | Age 20-64
In terms of in labor force | age 20-64, the demographic groups most similar to Samoans are Immigrants from North America (79.0%, a difference of 0.0%), Immigrants from Canada (79.0%, a difference of 0.020%), Tlingit-Haida (79.0%, a difference of 0.020%), Immigrants from Jamaica (79.0%, a difference of 0.030%), and Welsh (79.0%, a difference of 0.040%).
| Demographics | Rating | Rank | In Labor Force | Age 20-64 |
| Alsatians | 5.7 /100 | #229 | Tragic 79.1% |
| Native Hawaiians | 5.6 /100 | #230 | Tragic 79.1% |
| Lebanese | 5.1 /100 | #231 | Tragic 79.1% |
| Guamanians/Chamorros | 4.5 /100 | #232 | Tragic 79.1% |
| Japanese | 4.0 /100 | #233 | Tragic 79.1% |
| Immigrants | Canada | 3.2 /100 | #234 | Tragic 79.0% |
| Tlingit-Haida | 3.2 /100 | #235 | Tragic 79.0% |
| Samoans | 2.9 /100 | #236 | Tragic 79.0% |
| Immigrants | North America | 2.9 /100 | #237 | Tragic 79.0% |
| Immigrants | Jamaica | 2.6 /100 | #238 | Tragic 79.0% |
| Welsh | 2.4 /100 | #239 | Tragic 79.0% |
| Trinidadians and Tobagonians | 2.3 /100 | #240 | Tragic 79.0% |
| Jamaicans | 2.0 /100 | #241 | Tragic 78.9% |
| Immigrants | Micronesia | 1.9 /100 | #242 | Tragic 78.9% |
| Immigrants | West Indies | 1.7 /100 | #243 | Tragic 78.9% |