Immigrants from Armenia vs Laotian Master's Degree
COMPARE
Immigrants from Armenia
Laotian
Master's Degree
Master's Degree Comparison
Immigrants from Armenia
Laotians
14.5%
MASTER'S DEGREE
27.2/ 100
METRIC RATING
199th/ 347
METRIC RANK
17.0%
MASTER'S DEGREE
98.8/ 100
METRIC RATING
99th/ 347
METRIC RANK
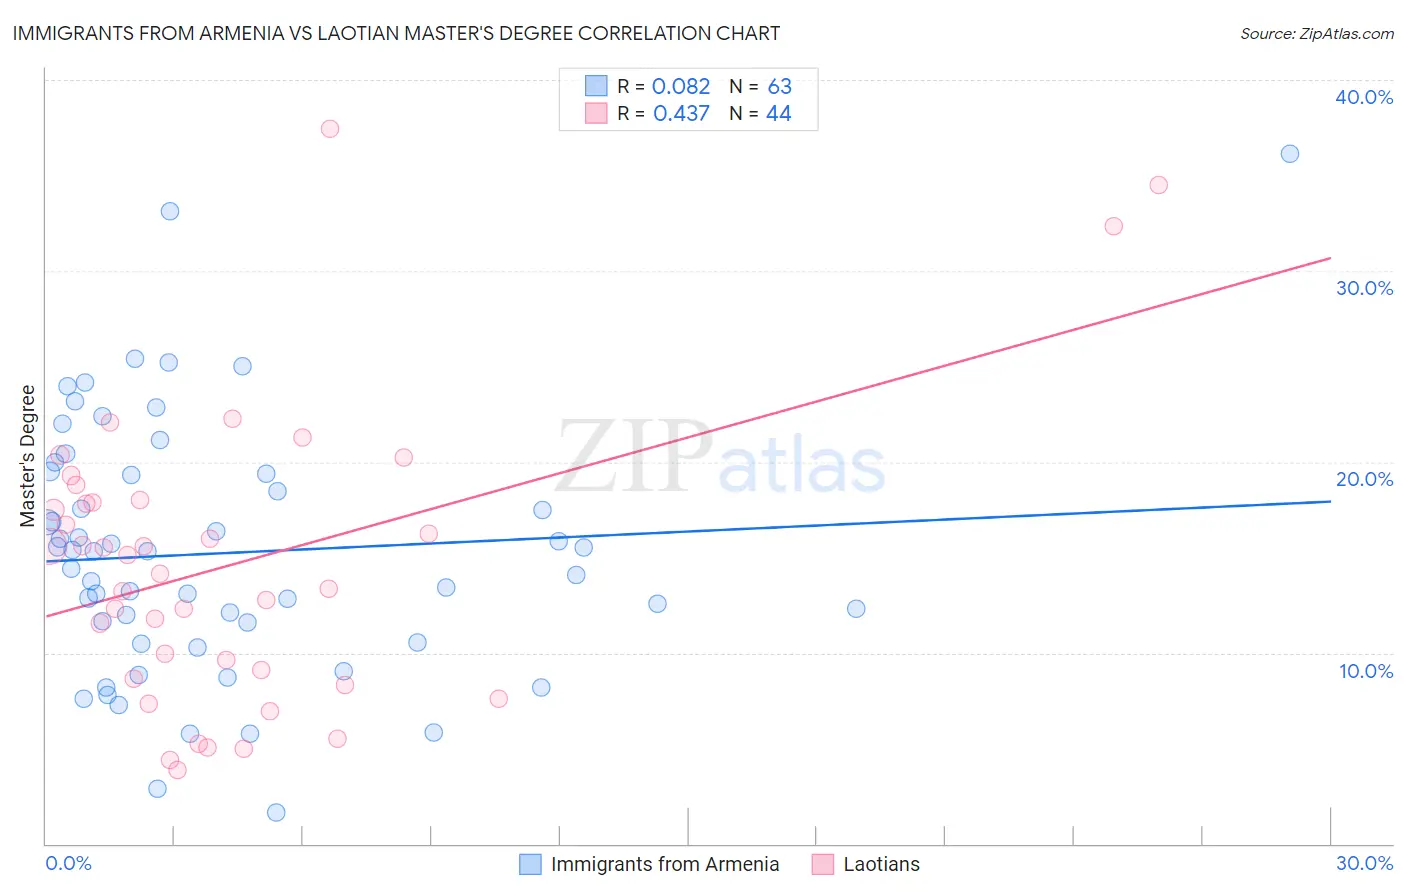
Immigrants from Armenia vs Laotian Master's Degree Correlation Chart
The statistical analysis conducted on geographies consisting of 97,719,576 people shows a slight positive correlation between the proportion of Immigrants from Armenia and percentage of population with at least master's degree education in the United States with a correlation coefficient (R) of 0.082 and weighted average of 14.5%. Similarly, the statistical analysis conducted on geographies consisting of 224,808,170 people shows a moderate positive correlation between the proportion of Laotians and percentage of population with at least master's degree education in the United States with a correlation coefficient (R) of 0.437 and weighted average of 17.0%, a difference of 17.8%.
Master's Degree Correlation Summary
| Measurement | Immigrants from Armenia | Laotian |
| Minimum | 1.7% | 3.9% |
| Maximum | 36.1% | 37.4% |
| Range | 34.5% | 33.6% |
| Mean | 15.2% | 14.6% |
| Median | 15.3% | 14.6% |
| Interquartile 25% (IQ1) | 10.5% | 8.9% |
| Interquartile 75% (IQ3) | 19.4% | 17.9% |
| Interquartile Range (IQR) | 8.9% | 9.1% |
| Standard Deviation (Sample) | 6.7% | 7.6% |
| Standard Deviation (Population) | 6.6% | 7.5% |
Similar Demographics by Master's Degree
Demographics Similar to Immigrants from Armenia by Master's Degree
In terms of master's degree, the demographic groups most similar to Immigrants from Armenia are West Indian (14.5%, a difference of 0.040%), Belgian (14.5%, a difference of 0.14%), Panamanian (14.4%, a difference of 0.36%), Scotch-Irish (14.4%, a difference of 0.37%), and Immigrants from Western Africa (14.4%, a difference of 0.38%).
| Demographics | Rating | Rank | Master's Degree |
| Immigrants | Middle Africa | 33.6 /100 | #192 | Fair 14.6% |
| Immigrants | Nigeria | 32.7 /100 | #193 | Fair 14.6% |
| Chinese | 32.5 /100 | #194 | Fair 14.6% |
| Danes | 31.3 /100 | #195 | Fair 14.5% |
| Czechoslovakians | 29.9 /100 | #196 | Fair 14.5% |
| Belgians | 28.0 /100 | #197 | Fair 14.5% |
| West Indians | 27.4 /100 | #198 | Fair 14.5% |
| Immigrants | Armenia | 27.2 /100 | #199 | Fair 14.5% |
| Panamanians | 25.1 /100 | #200 | Fair 14.4% |
| Scotch-Irish | 25.0 /100 | #201 | Fair 14.4% |
| Immigrants | Western Africa | 24.9 /100 | #202 | Fair 14.4% |
| Yugoslavians | 24.3 /100 | #203 | Fair 14.4% |
| French | 23.7 /100 | #204 | Fair 14.4% |
| Trinidadians and Tobagonians | 23.5 /100 | #205 | Fair 14.4% |
| Scandinavians | 23.3 /100 | #206 | Fair 14.4% |
Demographics Similar to Laotians by Master's Degree
In terms of master's degree, the demographic groups most similar to Laotians are Immigrants from Ukraine (17.0%, a difference of 0.060%), Immigrants from England (17.0%, a difference of 0.15%), Albanian (17.0%, a difference of 0.21%), Immigrants from Northern Africa (17.1%, a difference of 0.32%), and Immigrants from Morocco (17.1%, a difference of 0.35%).
| Demographics | Rating | Rank | Master's Degree |
| Immigrants | North America | 99.1 /100 | #92 | Exceptional 17.2% |
| Immigrants | Italy | 99.1 /100 | #93 | Exceptional 17.2% |
| Ugandans | 99.0 /100 | #94 | Exceptional 17.1% |
| Immigrants | Morocco | 98.9 /100 | #95 | Exceptional 17.1% |
| Immigrants | Northern Africa | 98.9 /100 | #96 | Exceptional 17.1% |
| Immigrants | England | 98.8 /100 | #97 | Exceptional 17.0% |
| Immigrants | Ukraine | 98.8 /100 | #98 | Exceptional 17.0% |
| Laotians | 98.8 /100 | #99 | Exceptional 17.0% |
| Albanians | 98.7 /100 | #100 | Exceptional 17.0% |
| Immigrants | Nepal | 98.6 /100 | #101 | Exceptional 17.0% |
| Chileans | 98.6 /100 | #102 | Exceptional 16.9% |
| Alsatians | 98.4 /100 | #103 | Exceptional 16.9% |
| Ukrainians | 98.3 /100 | #104 | Exceptional 16.9% |
| Syrians | 98.3 /100 | #105 | Exceptional 16.8% |
| Immigrants | Albania | 98.1 /100 | #106 | Exceptional 16.8% |