Immigrants from Armenia vs Alsatian In Labor Force | Age 45-54
COMPARE
Immigrants from Armenia
Alsatian
In Labor Force | Age 45-54
In Labor Force | Age 45-54 Comparison
Immigrants from Armenia
Alsatians
81.7%
IN LABOR FORCE | AGE 45-54
0.2/ 100
METRIC RATING
250th/ 347
METRIC RANK
81.3%
IN LABOR FORCE | AGE 45-54
0.0/ 100
METRIC RATING
269th/ 347
METRIC RANK
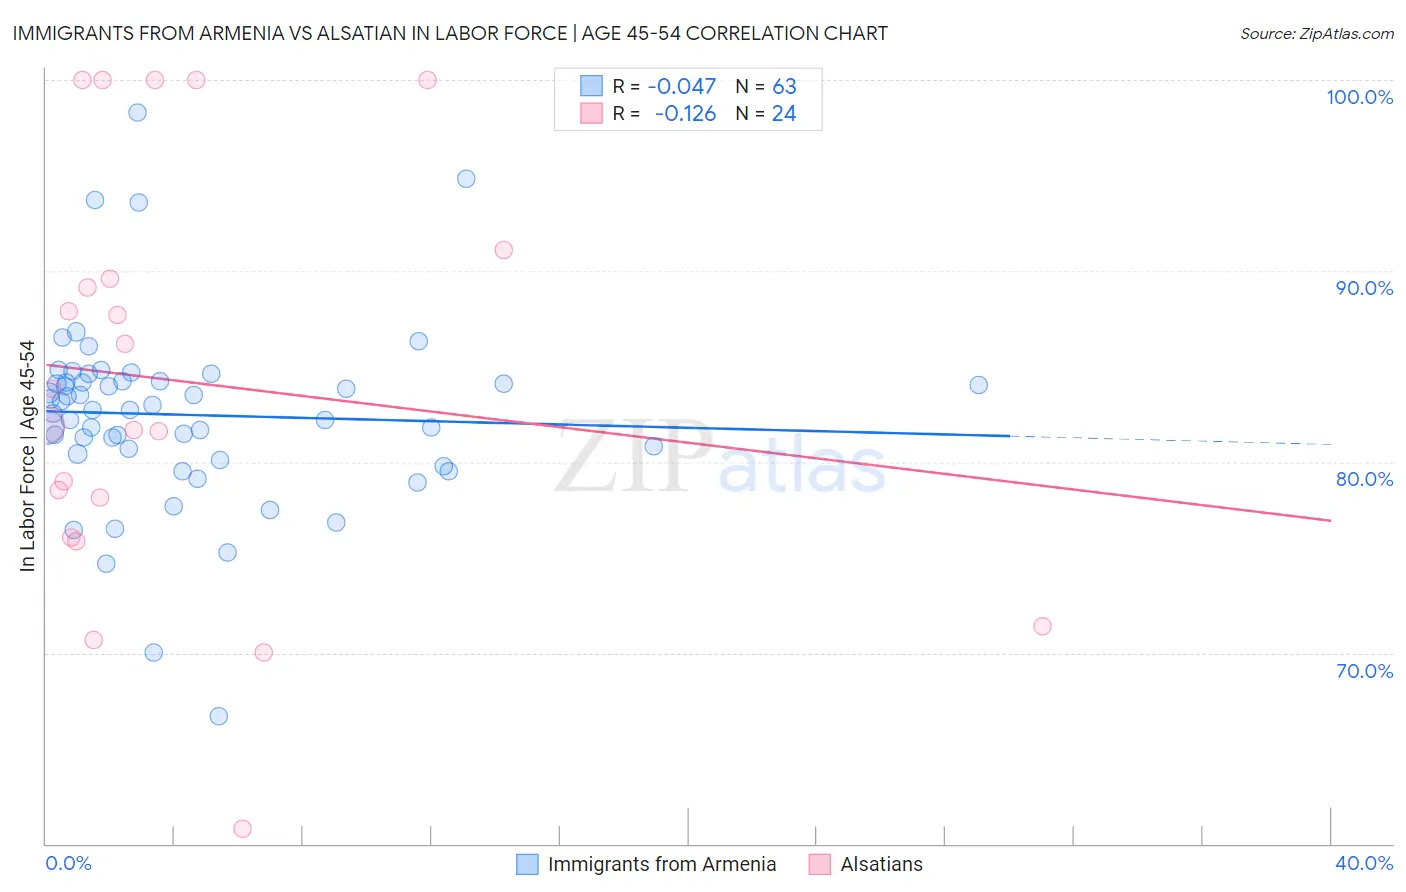
Immigrants from Armenia vs Alsatian In Labor Force | Age 45-54 Correlation Chart
The statistical analysis conducted on geographies consisting of 97,712,930 people shows no correlation between the proportion of Immigrants from Armenia and labor force participation rate among population between the ages 45 and 54 in the United States with a correlation coefficient (R) of -0.047 and weighted average of 81.7%. Similarly, the statistical analysis conducted on geographies consisting of 82,679,176 people shows a poor negative correlation between the proportion of Alsatians and labor force participation rate among population between the ages 45 and 54 in the United States with a correlation coefficient (R) of -0.126 and weighted average of 81.3%, a difference of 0.39%.
In Labor Force | Age 45-54 Correlation Summary
| Measurement | Immigrants from Armenia | Alsatian |
| Minimum | 66.7% | 60.8% |
| Maximum | 98.3% | 100.0% |
| Range | 31.6% | 39.2% |
| Mean | 82.5% | 84.2% |
| Median | 82.7% | 82.9% |
| Interquartile 25% (IQ1) | 80.4% | 77.1% |
| Interquartile 75% (IQ3) | 84.2% | 90.3% |
| Interquartile Range (IQR) | 3.8% | 13.2% |
| Standard Deviation (Sample) | 4.9% | 10.9% |
| Standard Deviation (Population) | 4.9% | 10.7% |
Demographics Similar to Immigrants from Armenia and Alsatians by In Labor Force | Age 45-54
In terms of in labor force | age 45-54, the demographic groups most similar to Immigrants from Armenia are Guamanian/Chamorro (81.6%, a difference of 0.020%), Pennsylvania German (81.6%, a difference of 0.040%), Hmong (81.7%, a difference of 0.050%), Japanese (81.6%, a difference of 0.070%), and Immigrants from Laos (81.6%, a difference of 0.070%). Similarly, the demographic groups most similar to Alsatians are Immigrants from Honduras (81.4%, a difference of 0.020%), West Indian (81.4%, a difference of 0.040%), Immigrants from St. Vincent and the Grenadines (81.4%, a difference of 0.050%), Honduran (81.4%, a difference of 0.13%), and Immigrants from West Indies (81.5%, a difference of 0.17%).
| Demographics | Rating | Rank | In Labor Force | Age 45-54 |
| Hmong | 0.3 /100 | #249 | Tragic 81.7% |
| Immigrants | Armenia | 0.2 /100 | #250 | Tragic 81.7% |
| Guamanians/Chamorros | 0.2 /100 | #251 | Tragic 81.6% |
| Pennsylvania Germans | 0.2 /100 | #252 | Tragic 81.6% |
| Japanese | 0.2 /100 | #253 | Tragic 81.6% |
| Immigrants | Laos | 0.2 /100 | #254 | Tragic 81.6% |
| Scotch-Irish | 0.2 /100 | #255 | Tragic 81.6% |
| Barbadians | 0.1 /100 | #256 | Tragic 81.6% |
| Immigrants | Congo | 0.1 /100 | #257 | Tragic 81.6% |
| Immigrants | Fiji | 0.1 /100 | #258 | Tragic 81.5% |
| Guyanese | 0.1 /100 | #259 | Tragic 81.5% |
| Spaniards | 0.1 /100 | #260 | Tragic 81.5% |
| Hawaiians | 0.1 /100 | #261 | Tragic 81.5% |
| Immigrants | Guyana | 0.1 /100 | #262 | Tragic 81.5% |
| Indonesians | 0.1 /100 | #263 | Tragic 81.5% |
| Immigrants | West Indies | 0.1 /100 | #264 | Tragic 81.5% |
| Hondurans | 0.1 /100 | #265 | Tragic 81.4% |
| Immigrants | St. Vincent and the Grenadines | 0.1 /100 | #266 | Tragic 81.4% |
| West Indians | 0.1 /100 | #267 | Tragic 81.4% |
| Immigrants | Honduras | 0.0 /100 | #268 | Tragic 81.4% |
| Alsatians | 0.0 /100 | #269 | Tragic 81.3% |