Immigrants from Armenia vs Nicaraguan In Labor Force | Age 30-34
COMPARE
Immigrants from Armenia
Nicaraguan
In Labor Force | Age 30-34
In Labor Force | Age 30-34 Comparison
Immigrants from Armenia
Nicaraguans
84.8%
IN LABOR FORCE | AGE 30-34
64.7/ 100
METRIC RATING
158th/ 347
METRIC RANK
83.9%
IN LABOR FORCE | AGE 30-34
0.6/ 100
METRIC RATING
251st/ 347
METRIC RANK
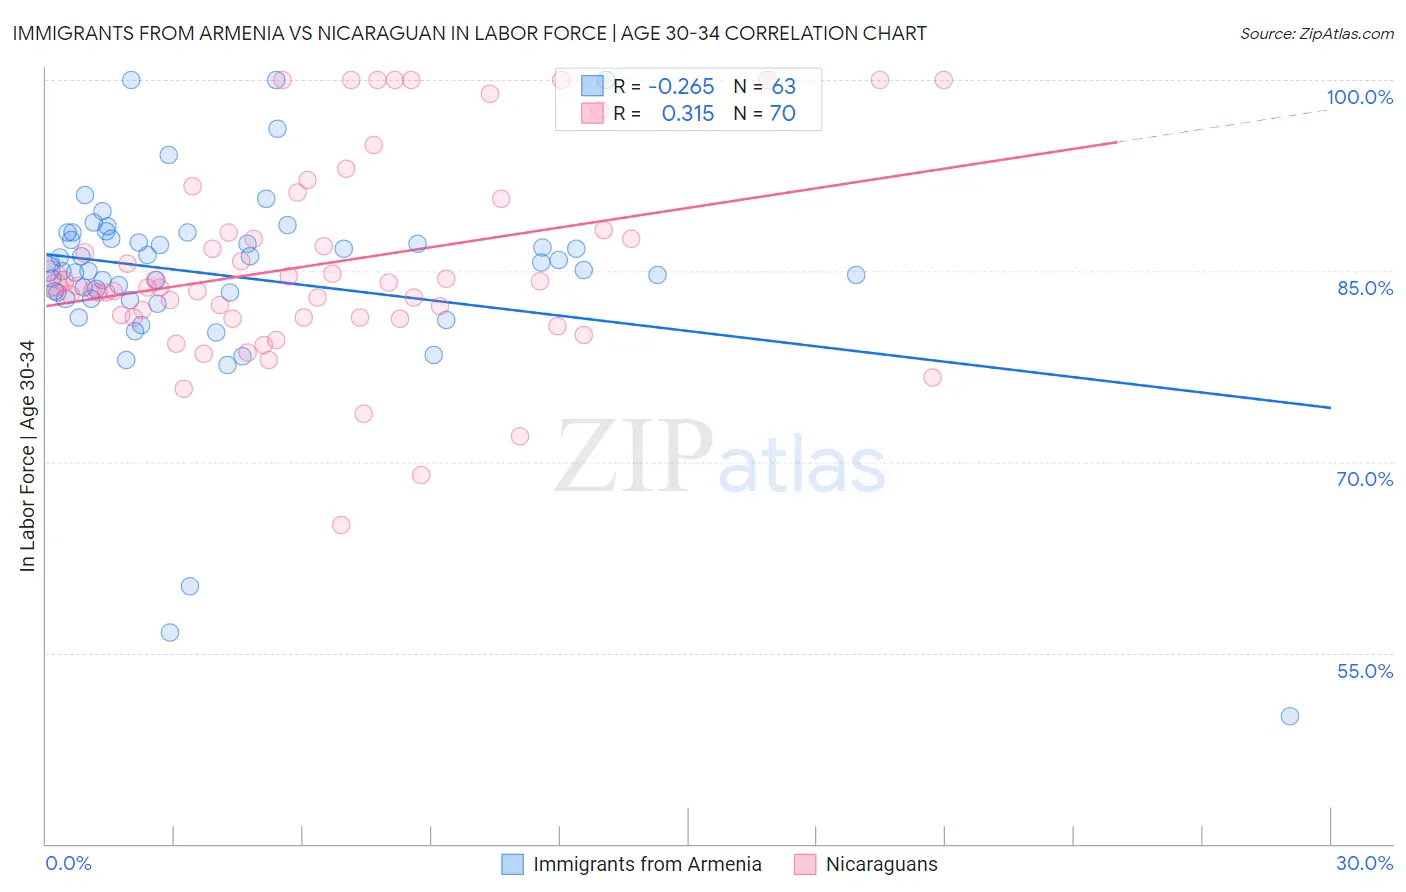
Immigrants from Armenia vs Nicaraguan In Labor Force | Age 30-34 Correlation Chart
The statistical analysis conducted on geographies consisting of 97,710,300 people shows a weak negative correlation between the proportion of Immigrants from Armenia and labor force participation rate among population between the ages 30 and 34 in the United States with a correlation coefficient (R) of -0.265 and weighted average of 84.8%. Similarly, the statistical analysis conducted on geographies consisting of 285,621,495 people shows a mild positive correlation between the proportion of Nicaraguans and labor force participation rate among population between the ages 30 and 34 in the United States with a correlation coefficient (R) of 0.315 and weighted average of 83.9%, a difference of 1.0%.
In Labor Force | Age 30-34 Correlation Summary
| Measurement | Immigrants from Armenia | Nicaraguan |
| Minimum | 50.0% | 65.0% |
| Maximum | 100.0% | 100.0% |
| Range | 50.0% | 35.0% |
| Mean | 84.6% | 85.6% |
| Median | 85.2% | 83.8% |
| Interquartile 25% (IQ1) | 82.9% | 81.3% |
| Interquartile 75% (IQ3) | 87.5% | 88.2% |
| Interquartile Range (IQR) | 4.6% | 6.9% |
| Standard Deviation (Sample) | 8.1% | 7.8% |
| Standard Deviation (Population) | 8.0% | 7.8% |
Similar Demographics by In Labor Force | Age 30-34
Demographics Similar to Immigrants from Armenia by In Labor Force | Age 30-34
In terms of in labor force | age 30-34, the demographic groups most similar to Immigrants from Armenia are Peruvian (84.8%, a difference of 0.010%), Czechoslovakian (84.8%, a difference of 0.010%), French Canadian (84.8%, a difference of 0.020%), Pakistani (84.7%, a difference of 0.030%), and Immigrants from Cambodia (84.7%, a difference of 0.030%).
| Demographics | Rating | Rank | In Labor Force | Age 30-34 |
| Immigrants | Senegal | 74.0 /100 | #151 | Good 84.8% |
| Romanians | 73.5 /100 | #152 | Good 84.8% |
| Syrians | 70.1 /100 | #153 | Good 84.8% |
| Northern Europeans | 70.0 /100 | #154 | Good 84.8% |
| Immigrants | Sudan | 69.5 /100 | #155 | Good 84.8% |
| French Canadians | 67.3 /100 | #156 | Good 84.8% |
| Peruvians | 65.9 /100 | #157 | Good 84.8% |
| Immigrants | Armenia | 64.7 /100 | #158 | Good 84.8% |
| Czechoslovakians | 63.0 /100 | #159 | Good 84.8% |
| Pakistanis | 60.8 /100 | #160 | Good 84.7% |
| Immigrants | Cambodia | 60.7 /100 | #161 | Good 84.7% |
| South Americans | 58.7 /100 | #162 | Average 84.7% |
| Immigrants | Uruguay | 57.4 /100 | #163 | Average 84.7% |
| Icelanders | 56.8 /100 | #164 | Average 84.7% |
| Immigrants | Western Europe | 56.7 /100 | #165 | Average 84.7% |
Demographics Similar to Nicaraguans by In Labor Force | Age 30-34
In terms of in labor force | age 30-34, the demographic groups most similar to Nicaraguans are Bahamian (83.9%, a difference of 0.0%), Immigrants from Nicaragua (83.9%, a difference of 0.010%), Immigrants from Iraq (83.9%, a difference of 0.020%), Immigrants from St. Vincent and the Grenadines (83.9%, a difference of 0.030%), and Portuguese (84.0%, a difference of 0.040%).
| Demographics | Rating | Rank | In Labor Force | Age 30-34 |
| Basques | 0.9 /100 | #244 | Tragic 84.0% |
| Immigrants | Venezuela | 0.9 /100 | #245 | Tragic 84.0% |
| Central Americans | 0.9 /100 | #246 | Tragic 84.0% |
| British West Indians | 0.8 /100 | #247 | Tragic 84.0% |
| Portuguese | 0.8 /100 | #248 | Tragic 84.0% |
| Immigrants | Dominica | 0.7 /100 | #249 | Tragic 84.0% |
| Immigrants | Iraq | 0.7 /100 | #250 | Tragic 83.9% |
| Nicaraguans | 0.6 /100 | #251 | Tragic 83.9% |
| Bahamians | 0.6 /100 | #252 | Tragic 83.9% |
| Immigrants | Nicaragua | 0.6 /100 | #253 | Tragic 83.9% |
| Immigrants | St. Vincent and the Grenadines | 0.5 /100 | #254 | Tragic 83.9% |
| Whites/Caucasians | 0.5 /100 | #255 | Tragic 83.9% |
| Immigrants | Lebanon | 0.4 /100 | #256 | Tragic 83.9% |
| Iraqis | 0.3 /100 | #257 | Tragic 83.8% |
| Hondurans | 0.3 /100 | #258 | Tragic 83.8% |