Immigrants from Armenia vs Immigrants from Indonesia Cognitive Disability
COMPARE
Immigrants from Armenia
Immigrants from Indonesia
Cognitive Disability
Cognitive Disability Comparison
Immigrants from Armenia
Immigrants from Indonesia
17.9%
COGNITIVE DISABILITY
0.6/ 100
METRIC RATING
258th/ 347
METRIC RANK
17.1%
COGNITIVE DISABILITY
82.7/ 100
METRIC RATING
152nd/ 347
METRIC RANK
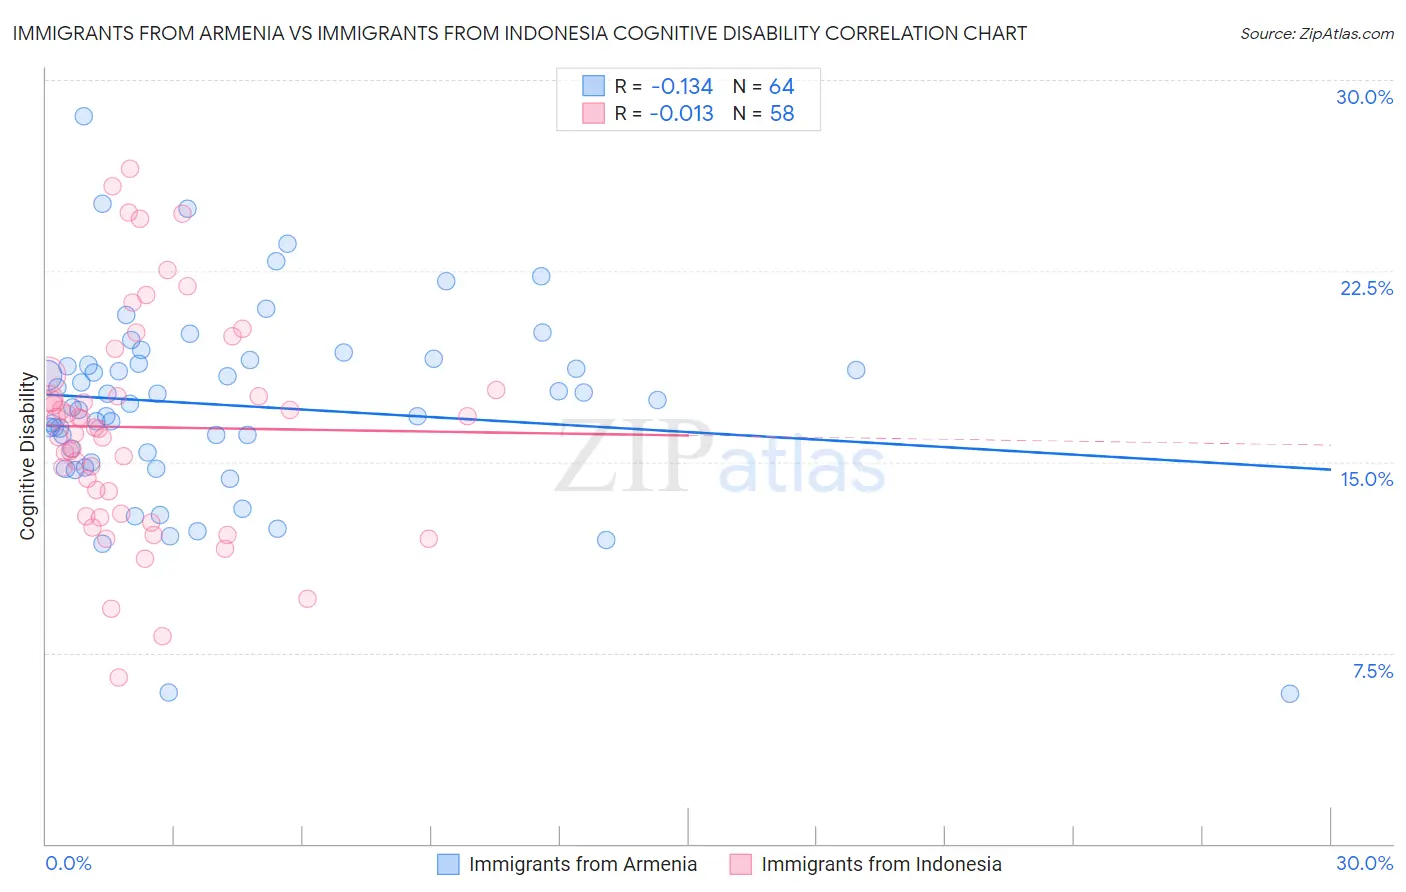
Immigrants from Armenia vs Immigrants from Indonesia Cognitive Disability Correlation Chart
The statistical analysis conducted on geographies consisting of 97,717,666 people shows a poor negative correlation between the proportion of Immigrants from Armenia and percentage of population with cognitive disability in the United States with a correlation coefficient (R) of -0.134 and weighted average of 17.9%. Similarly, the statistical analysis conducted on geographies consisting of 215,789,545 people shows no correlation between the proportion of Immigrants from Indonesia and percentage of population with cognitive disability in the United States with a correlation coefficient (R) of -0.013 and weighted average of 17.1%, a difference of 4.8%.
Cognitive Disability Correlation Summary
| Measurement | Immigrants from Armenia | Immigrants from Indonesia |
| Minimum | 5.9% | 6.5% |
| Maximum | 28.6% | 26.5% |
| Range | 22.7% | 20.0% |
| Mean | 17.2% | 16.4% |
| Median | 17.4% | 16.3% |
| Interquartile 25% (IQ1) | 15.2% | 12.9% |
| Interquartile 75% (IQ3) | 18.9% | 17.8% |
| Interquartile Range (IQR) | 3.8% | 4.9% |
| Standard Deviation (Sample) | 3.9% | 4.3% |
| Standard Deviation (Population) | 3.9% | 4.3% |
Similar Demographics by Cognitive Disability
Demographics Similar to Immigrants from Armenia by Cognitive Disability
In terms of cognitive disability, the demographic groups most similar to Immigrants from Armenia are Mexican American Indian (17.9%, a difference of 0.010%), Immigrants from the Azores (17.9%, a difference of 0.050%), Bahamian (17.9%, a difference of 0.050%), Hopi (17.9%, a difference of 0.060%), and Hispanic or Latino (17.9%, a difference of 0.060%).
| Demographics | Rating | Rank | Cognitive Disability |
| Malaysians | 0.6 /100 | #251 | Tragic 17.9% |
| Immigrants | Grenada | 0.6 /100 | #252 | Tragic 17.9% |
| Hopi | 0.6 /100 | #253 | Tragic 17.9% |
| Hispanics or Latinos | 0.6 /100 | #254 | Tragic 17.9% |
| Immigrants | Azores | 0.6 /100 | #255 | Tragic 17.9% |
| Bahamians | 0.6 /100 | #256 | Tragic 17.9% |
| Mexican American Indians | 0.6 /100 | #257 | Tragic 17.9% |
| Immigrants | Armenia | 0.6 /100 | #258 | Tragic 17.9% |
| Ethiopians | 0.5 /100 | #259 | Tragic 17.9% |
| Immigrants | Belize | 0.5 /100 | #260 | Tragic 17.9% |
| Guamanians/Chamorros | 0.5 /100 | #261 | Tragic 17.9% |
| Sierra Leoneans | 0.4 /100 | #262 | Tragic 17.9% |
| Immigrants | Barbados | 0.4 /100 | #263 | Tragic 17.9% |
| Menominee | 0.4 /100 | #264 | Tragic 18.0% |
| Spanish Americans | 0.4 /100 | #265 | Tragic 18.0% |
Demographics Similar to Immigrants from Indonesia by Cognitive Disability
In terms of cognitive disability, the demographic groups most similar to Immigrants from Indonesia are Syrian (17.1%, a difference of 0.020%), Immigrants from Kazakhstan (17.1%, a difference of 0.10%), Basque (17.1%, a difference of 0.15%), French Canadian (17.1%, a difference of 0.16%), and Cypriot (17.1%, a difference of 0.16%).
| Demographics | Rating | Rank | Cognitive Disability |
| Immigrants | South Eastern Asia | 88.7 /100 | #145 | Excellent 17.0% |
| Costa Ricans | 88.0 /100 | #146 | Excellent 17.0% |
| Scotch-Irish | 85.9 /100 | #147 | Excellent 17.1% |
| French Canadians | 85.7 /100 | #148 | Excellent 17.1% |
| Cypriots | 85.7 /100 | #149 | Excellent 17.1% |
| Basques | 85.5 /100 | #150 | Excellent 17.1% |
| Syrians | 83.0 /100 | #151 | Excellent 17.1% |
| Immigrants | Indonesia | 82.7 /100 | #152 | Excellent 17.1% |
| Immigrants | Kazakhstan | 80.5 /100 | #153 | Excellent 17.1% |
| Immigrants | Malaysia | 79.3 /100 | #154 | Good 17.1% |
| Brazilians | 78.9 /100 | #155 | Good 17.1% |
| Sri Lankans | 78.9 /100 | #156 | Good 17.1% |
| Immigrants | Australia | 76.0 /100 | #157 | Good 17.1% |
| Celtics | 74.1 /100 | #158 | Good 17.1% |
| Immigrants | Latvia | 73.2 /100 | #159 | Good 17.2% |