Immigrants from Argentina vs Immigrants from Italy In Labor Force | Age 45-54
COMPARE
Immigrants from Argentina
Immigrants from Italy
In Labor Force | Age 45-54
In Labor Force | Age 45-54 Comparison
Immigrants from Argentina
Immigrants from Italy
83.3%
IN LABOR FORCE | AGE 45-54
94.9/ 100
METRIC RATING
95th/ 347
METRIC RANK
83.2%
IN LABOR FORCE | AGE 45-54
92.5/ 100
METRIC RATING
111th/ 347
METRIC RANK
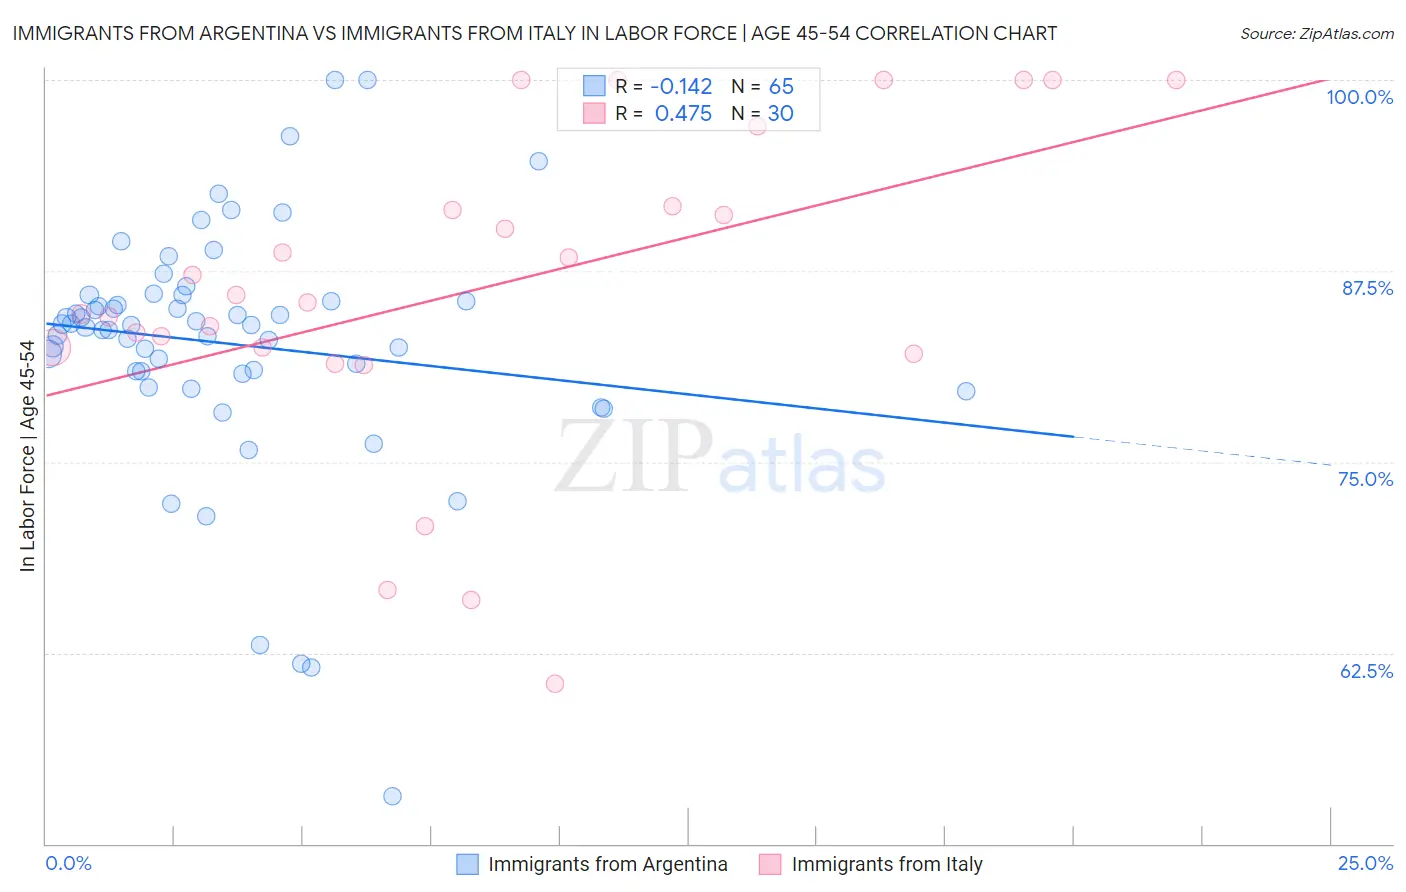
Immigrants from Argentina vs Immigrants from Italy In Labor Force | Age 45-54 Correlation Chart
The statistical analysis conducted on geographies consisting of 264,349,552 people shows a poor negative correlation between the proportion of Immigrants from Argentina and labor force participation rate among population between the ages 45 and 54 in the United States with a correlation coefficient (R) of -0.142 and weighted average of 83.3%. Similarly, the statistical analysis conducted on geographies consisting of 324,135,174 people shows a moderate positive correlation between the proportion of Immigrants from Italy and labor force participation rate among population between the ages 45 and 54 in the United States with a correlation coefficient (R) of 0.475 and weighted average of 83.2%, a difference of 0.090%.
In Labor Force | Age 45-54 Correlation Summary
| Measurement | Immigrants from Argentina | Immigrants from Italy |
| Minimum | 53.1% | 60.5% |
| Maximum | 100.0% | 100.0% |
| Range | 46.9% | 39.5% |
| Mean | 82.7% | 86.4% |
| Median | 83.9% | 85.7% |
| Interquartile 25% (IQ1) | 80.8% | 82.5% |
| Interquartile 75% (IQ3) | 85.7% | 91.7% |
| Interquartile Range (IQR) | 4.9% | 9.2% |
| Standard Deviation (Sample) | 8.1% | 10.5% |
| Standard Deviation (Population) | 8.0% | 10.3% |
Demographics Similar to Immigrants from Argentina and Immigrants from Italy by In Labor Force | Age 45-54
In terms of in labor force | age 45-54, the demographic groups most similar to Immigrants from Argentina are Argentinean (83.3%, a difference of 0.0%), Immigrants from Kuwait (83.3%, a difference of 0.0%), Palestinian (83.3%, a difference of 0.0%), Italian (83.3%, a difference of 0.010%), and Maltese (83.3%, a difference of 0.020%). Similarly, the demographic groups most similar to Immigrants from Italy are Immigrants from Africa (83.2%, a difference of 0.0%), Immigrants from Afghanistan (83.2%, a difference of 0.0%), Iranian (83.2%, a difference of 0.010%), Slovak (83.2%, a difference of 0.010%), and Ukrainian (83.2%, a difference of 0.010%).
| Demographics | Rating | Rank | In Labor Force | Age 45-54 |
| Italians | 95.1 /100 | #93 | Exceptional 83.3% |
| Argentineans | 94.9 /100 | #94 | Exceptional 83.3% |
| Immigrants | Argentina | 94.9 /100 | #95 | Exceptional 83.3% |
| Immigrants | Kuwait | 94.8 /100 | #96 | Exceptional 83.3% |
| Palestinians | 94.8 /100 | #97 | Exceptional 83.3% |
| Maltese | 94.4 /100 | #98 | Exceptional 83.3% |
| Immigrants | Middle Africa | 94.3 /100 | #99 | Exceptional 83.3% |
| Mongolians | 94.2 /100 | #100 | Exceptional 83.3% |
| Immigrants | Belarus | 94.1 /100 | #101 | Exceptional 83.3% |
| Immigrants | Singapore | 93.9 /100 | #102 | Exceptional 83.3% |
| Albanians | 93.9 /100 | #103 | Exceptional 83.3% |
| Immigrants | Romania | 93.8 /100 | #104 | Exceptional 83.3% |
| Immigrants | South America | 93.5 /100 | #105 | Exceptional 83.2% |
| Sri Lankans | 93.2 /100 | #106 | Exceptional 83.2% |
| Iranians | 92.9 /100 | #107 | Exceptional 83.2% |
| Slovaks | 92.8 /100 | #108 | Exceptional 83.2% |
| Ukrainians | 92.7 /100 | #109 | Exceptional 83.2% |
| Immigrants | Africa | 92.6 /100 | #110 | Exceptional 83.2% |
| Immigrants | Italy | 92.5 /100 | #111 | Exceptional 83.2% |
| Immigrants | Afghanistan | 92.4 /100 | #112 | Exceptional 83.2% |
| Immigrants | Albania | 91.8 /100 | #113 | Exceptional 83.2% |