Immigrants from Africa vs South American Indian Male Unemployment
COMPARE
Immigrants from Africa
South American Indian
Male Unemployment
Male Unemployment Comparison
Immigrants from Africa
South American Indians
5.6%
MALE UNEMPLOYMENT
1.7/ 100
METRIC RATING
230th/ 347
METRIC RANK
5.5%
MALE UNEMPLOYMENT
7.6/ 100
METRIC RATING
210th/ 347
METRIC RANK
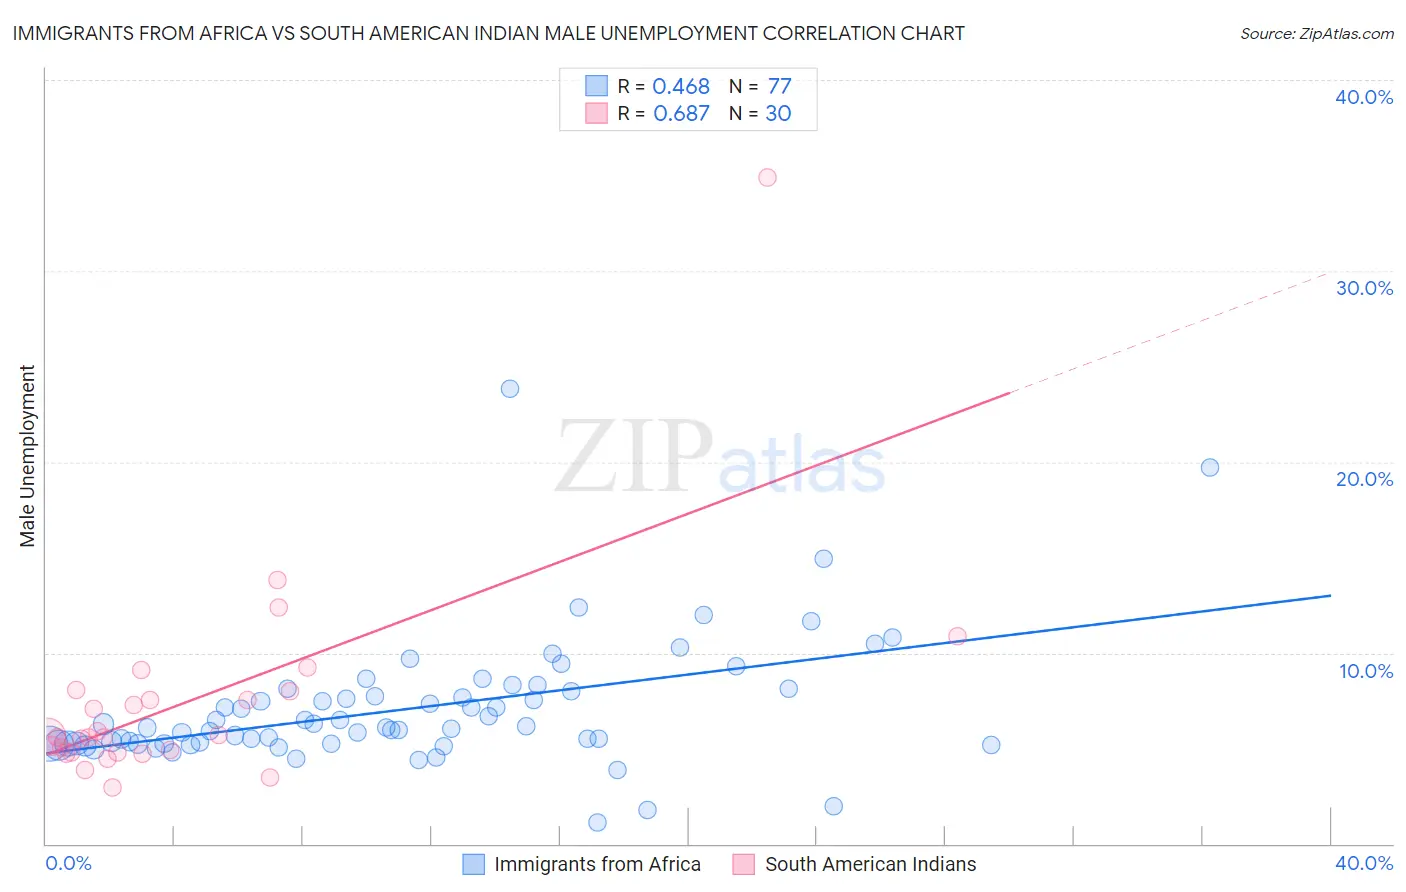
Immigrants from Africa vs South American Indian Male Unemployment Correlation Chart
The statistical analysis conducted on geographies consisting of 466,728,054 people shows a moderate positive correlation between the proportion of Immigrants from Africa and unemployment rate among males in the United States with a correlation coefficient (R) of 0.468 and weighted average of 5.6%. Similarly, the statistical analysis conducted on geographies consisting of 164,403,972 people shows a significant positive correlation between the proportion of South American Indians and unemployment rate among males in the United States with a correlation coefficient (R) of 0.687 and weighted average of 5.5%, a difference of 2.2%.
Male Unemployment Correlation Summary
| Measurement | Immigrants from Africa | South American Indian |
| Minimum | 1.1% | 2.9% |
| Maximum | 23.8% | 34.9% |
| Range | 22.7% | 32.0% |
| Mean | 7.1% | 7.5% |
| Median | 6.1% | 5.6% |
| Interquartile 25% (IQ1) | 5.2% | 4.8% |
| Interquartile 75% (IQ3) | 8.0% | 8.0% |
| Interquartile Range (IQR) | 2.8% | 3.2% |
| Standard Deviation (Sample) | 3.4% | 5.8% |
| Standard Deviation (Population) | 3.3% | 5.7% |
Demographics Similar to Immigrants from Africa and South American Indians by Male Unemployment
In terms of male unemployment, the demographic groups most similar to Immigrants from Africa are Seminole (5.6%, a difference of 0.040%), Central American (5.6%, a difference of 0.040%), Immigrants from Cambodia (5.6%, a difference of 0.060%), Immigrants from Panama (5.6%, a difference of 0.060%), and Panamanian (5.6%, a difference of 0.15%). Similarly, the demographic groups most similar to South American Indians are Israeli (5.5%, a difference of 0.040%), Hmong (5.5%, a difference of 0.14%), Ugandan (5.5%, a difference of 0.30%), Puget Sound Salish (5.5%, a difference of 0.47%), and Samoan (5.5%, a difference of 0.67%).
| Demographics | Rating | Rank | Male Unemployment |
| South American Indians | 7.6 /100 | #210 | Tragic 5.5% |
| Israelis | 7.4 /100 | #211 | Tragic 5.5% |
| Hmong | 7.0 /100 | #212 | Tragic 5.5% |
| Ugandans | 6.3 /100 | #213 | Tragic 5.5% |
| Puget Sound Salish | 5.6 /100 | #214 | Tragic 5.5% |
| Samoans | 4.9 /100 | #215 | Tragic 5.5% |
| Immigrants | Immigrants | 4.3 /100 | #216 | Tragic 5.5% |
| Delaware | 4.2 /100 | #217 | Tragic 5.5% |
| Immigrants | Albania | 3.6 /100 | #218 | Tragic 5.5% |
| Immigrants | Western Asia | 3.5 /100 | #219 | Tragic 5.6% |
| Portuguese | 3.5 /100 | #220 | Tragic 5.6% |
| Soviet Union | 3.2 /100 | #221 | Tragic 5.6% |
| Immigrants | Micronesia | 2.9 /100 | #222 | Tragic 5.6% |
| Creek | 2.6 /100 | #223 | Tragic 5.6% |
| Cherokee | 2.4 /100 | #224 | Tragic 5.6% |
| Panamanians | 1.9 /100 | #225 | Tragic 5.6% |
| Immigrants | Cambodia | 1.8 /100 | #226 | Tragic 5.6% |
| Immigrants | Panama | 1.8 /100 | #227 | Tragic 5.6% |
| Seminole | 1.8 /100 | #228 | Tragic 5.6% |
| Central Americans | 1.8 /100 | #229 | Tragic 5.6% |
| Immigrants | Africa | 1.7 /100 | #230 | Tragic 5.6% |